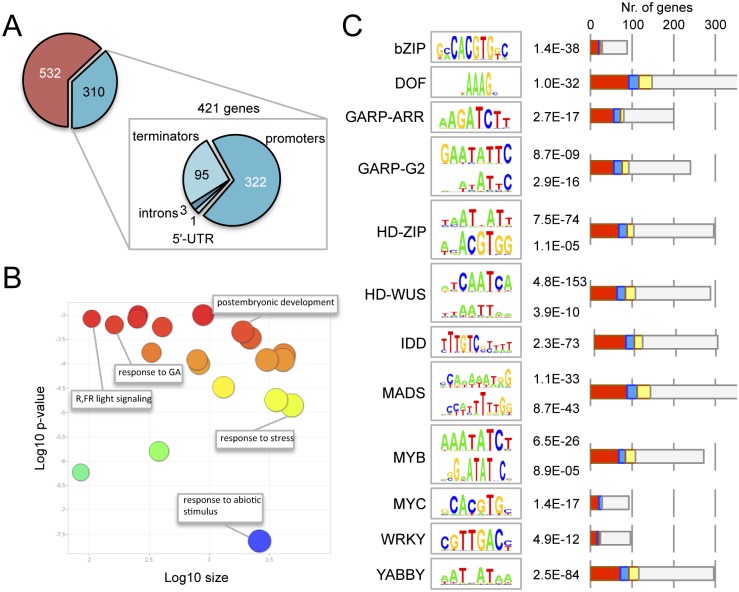
Fig 1. Genome-wide occupancy of RGA at target loci.
(A) Genomic location of the statistically significant peaks of GFP-RGA along its target genes. (B) Gene ontology analysis of RGA targets, using ReviGO. (C) Statistically significant over-representation of cis elements for different transcription factor families. The p value for each element is indicated. Bars represent the number of genes with at least one copy of the corresponding cis element in the ChIP peak. Colours indicate induction (red), repression (blue), both (yellow) or no effect (gray) by DELLAs across all published transcriptomic datasets. Please note that each ChIP peak may contain more than one cis element, therefore the sum of all genes in the graph is much larger than the 421 genes associated to ChIP peaks.

