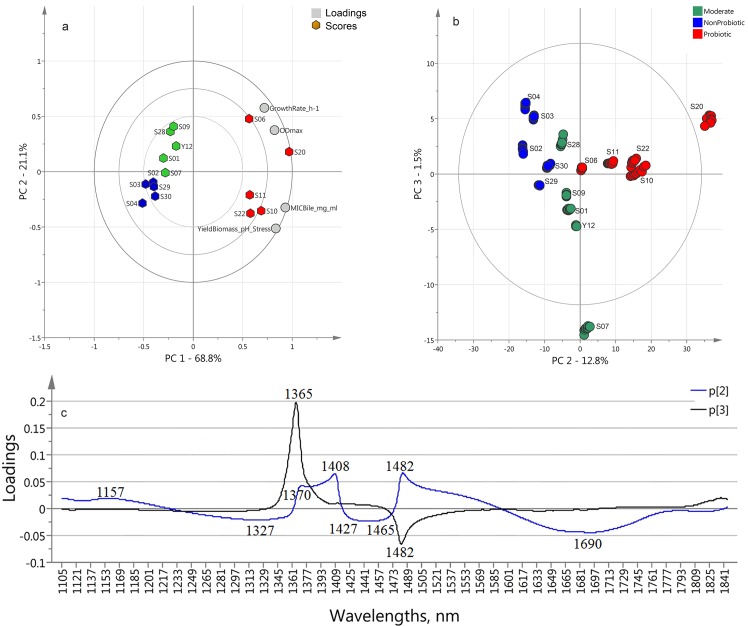
Fig 2. a) PCA Bi-plot calculated on the reference data (strains growth rates, maximal optical densities, bile MIC and the yield of biomass after three hours stay at pH 1.80 in presence of pepsin (9000 U/ml), reference data in Table 1); b) MW-PCA analyses using the 1100–1850 nm wavelength interval—Score plot calculated on spectral data (n = 150) at the cultivation time of 11.4–12 h.
Probiotic (red symbols), moderate (green symbols) and non-probiotic (blue symbols) groups; c) loadings of PC2 (blue line) and PC3 (black line) of MW-PCA model highlighting the bands.

