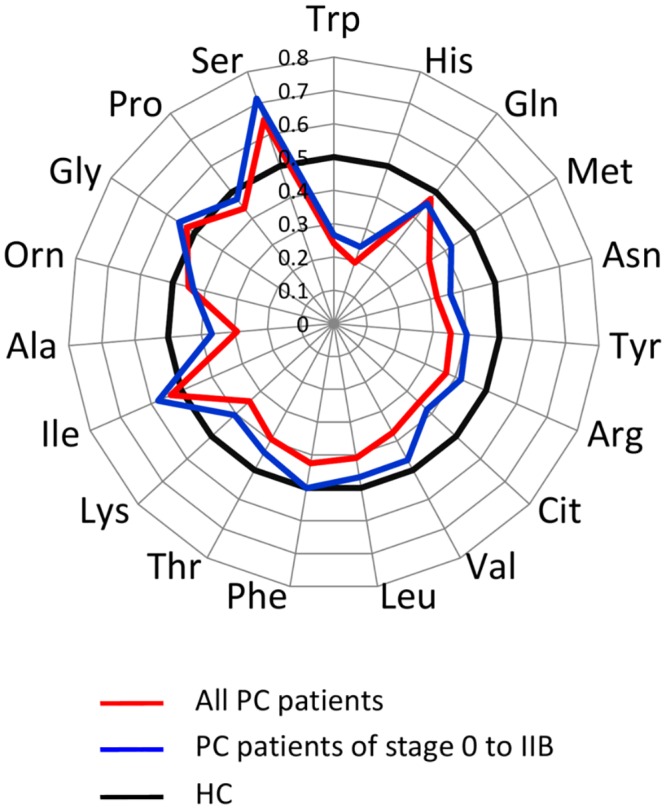
Fig 2. PFAA profiles of PC patients.

The results of receiver–operator characteristic (ROC) curve analysis of PFAA profiles in the training set (120 PC and matching 600 HC). Axes show the AUC of ROC for each amino acid to discriminate patients from healthy controls. Black bold lines indicate the point where the AUC of ROC = 0.5.
