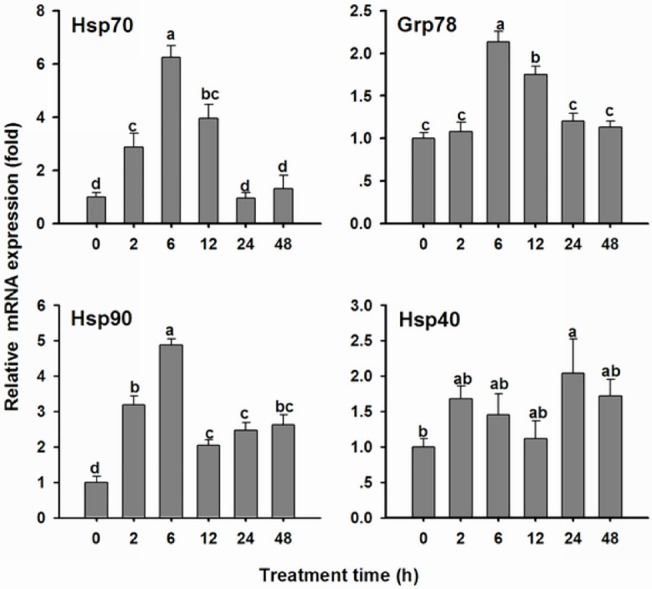
Fig 4. mRNA expression of O. chinensis Hsps at different times after acute Cd exposure.

The bars represent the mean ± SE (n = 3) of target gene mRNA expression in 5th instar nymphs 0 h, 2 h, 6 h, 12 h, 24 h and 48 h after the injection of 2.7 mg·kg-1 Cd. The small letters on the bars indicate significant differences between the different treatment times (Duncan’s multiple comparison, P< 0.05). The mRNA level at 0 h was arbitrarily taken as 1.0.
