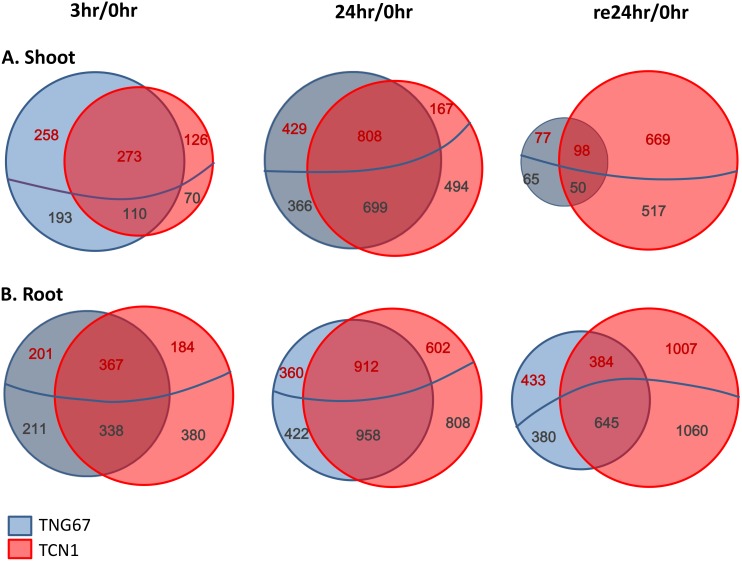
Fig 2. Venn diagram of DEGs in the shoots and roots of TNG67 and TCN1 rice seedlings exposed to cold (3 and 24 hr) and allowed to recover for 1 day (24 hr).
The upregulated genes are shown above the blue line with the expression levels written in red, while the downregulated genes are shown below the blue line with the expression levels written in dark grey. DEGs with significant expression changes in the shoots (A) and roots (B) of TNG67 and TCN1 rice seedlings. Genes with a greater than two-fold change in expression compared with the control and a significant t test (p < 0.05) result were considered DEGs.

