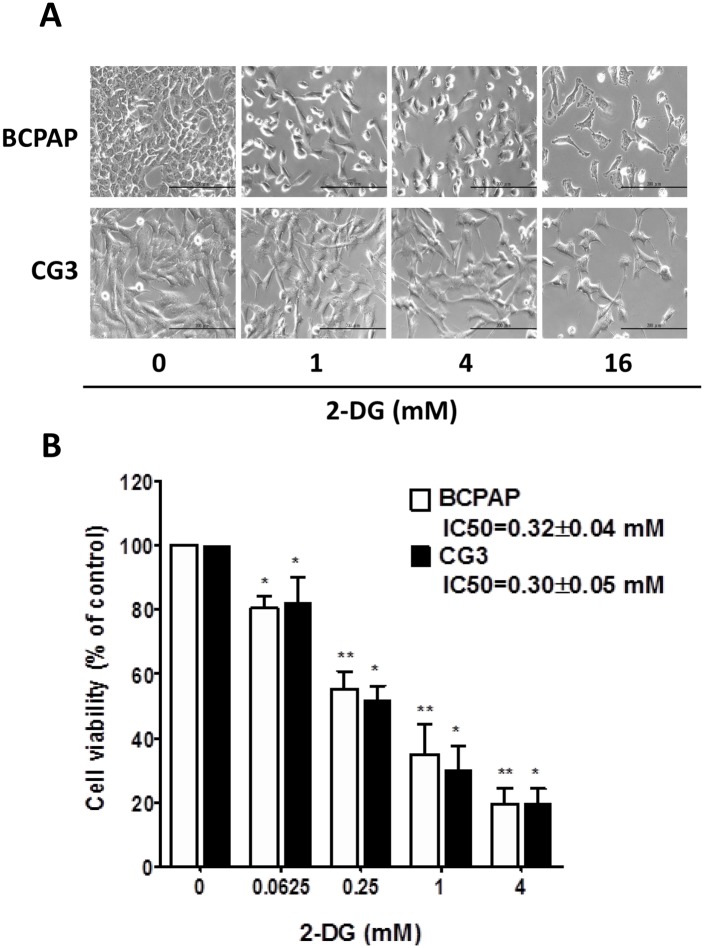
Fig 2. Susceptibility of PTC cells to 2-DG.
(A) Morphological changes were observed using a microscopy (magnification: 200×). BCPAP and CG3 cells were treated for 48 h with 0, 1, 4, and 16 mM 2-deoxy-d-glucose (2-DG). (B) BCPAP and CG3 cells were treated for 48 h with 0, 0.0625, 0.25, 1, and 4 mM 2-DG. Cell viability was measured using a WST-1 assay. Data are shown as a percentage of the controls (untreated) cells. Student’s t test was used to compare the controls and treated cells. *p < 0.05, **p < 0.001, compared to the controls. Data are presented as means ± standard deviation (SD).

