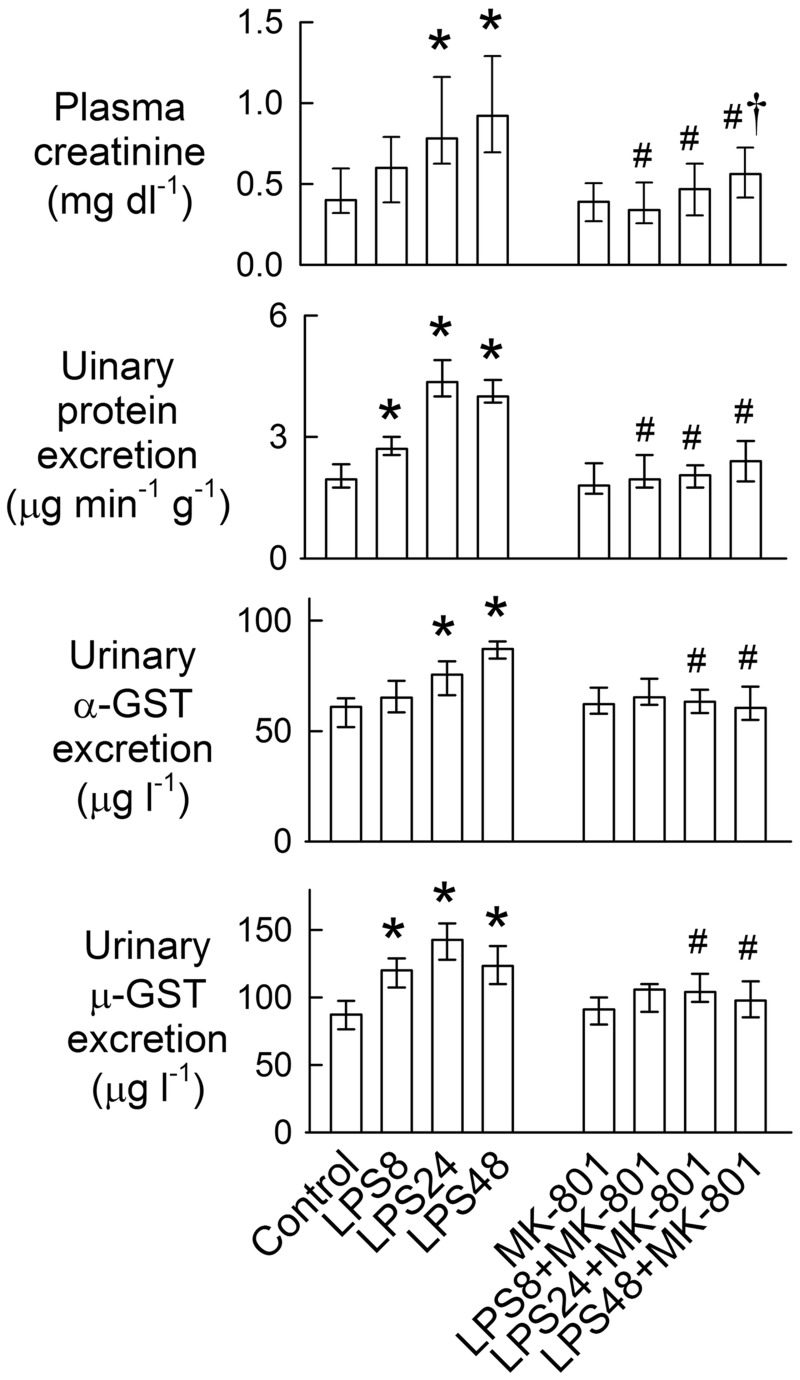
Fig 1. Effects of MK-801 on lipopolysaccharide (LPS)-mediated changes in plasma creatinine, proteinuria, and enzymuria.
The bar represents 50% of the values (median) with the upper bar representing the 75th percentile (Q3) and the lower bar representing the 25th percentile (Q1). N = 8 in each group. *P < 0.05 vs. the control groups. #P < 0.05 vs. the LPS group at the same time-point. †P < 0.05 vs. the MK-801 group.

