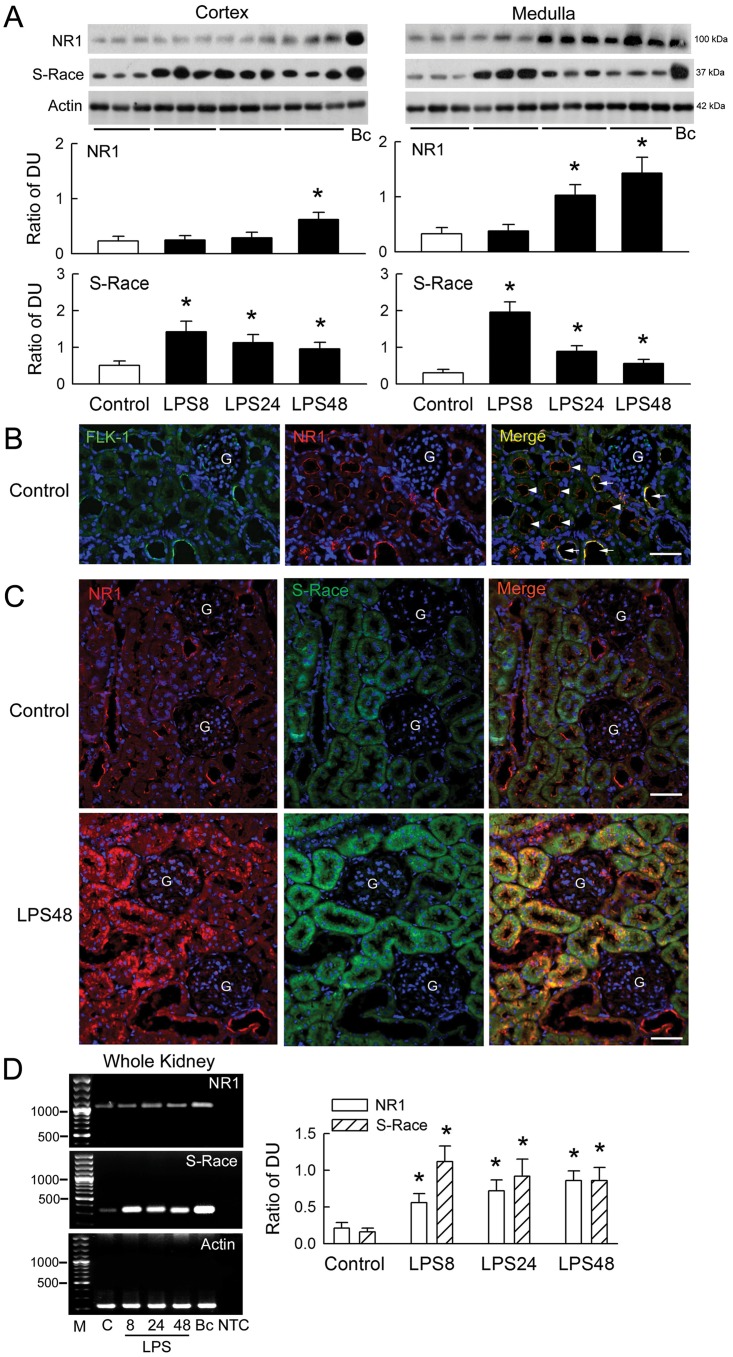
Fig 3. Changes in NR1 and S-Race expression in the rat kidney.
(A) The upper panels show representative blots from control and lipopolysaccharide (LPS)-treated kidneys at 8, 24, and 48 h (n = 3), together with a positive sample obtained from brain cortex (Bc). Bar graphs show the ratio of NR1 or S-Race to actin [expressed as densitometric units (DU)] (n = 8). (B) Representative micrographs of FLK-1- (green) and NR1- (red) positive immunoreactivity, and co-localized immunofluorescence (yellow color in merged picture) in the control kidney. Nuclei were counterstained with DAPI (blue). G, glomerulus. The horizontal bars in merged pictures indicate 150 μm. (C) Representative pictures of NR1- (red) and S-Race- (green) expression, and co-localization (orange color in merged picture) in the control kidney (upper) and LPS48 kidney (lower). Magnification: ×200 in B and C. (D) Right panels: representative gels showing NR1 and S-Race mRNA expression. M, 100 bp DNA ladder; C, control; Bc, brain cortex; NTC, no template control. The bar graphs on the left show the DU ratio (n = 8). *P < 0.05 vs. the control group.

