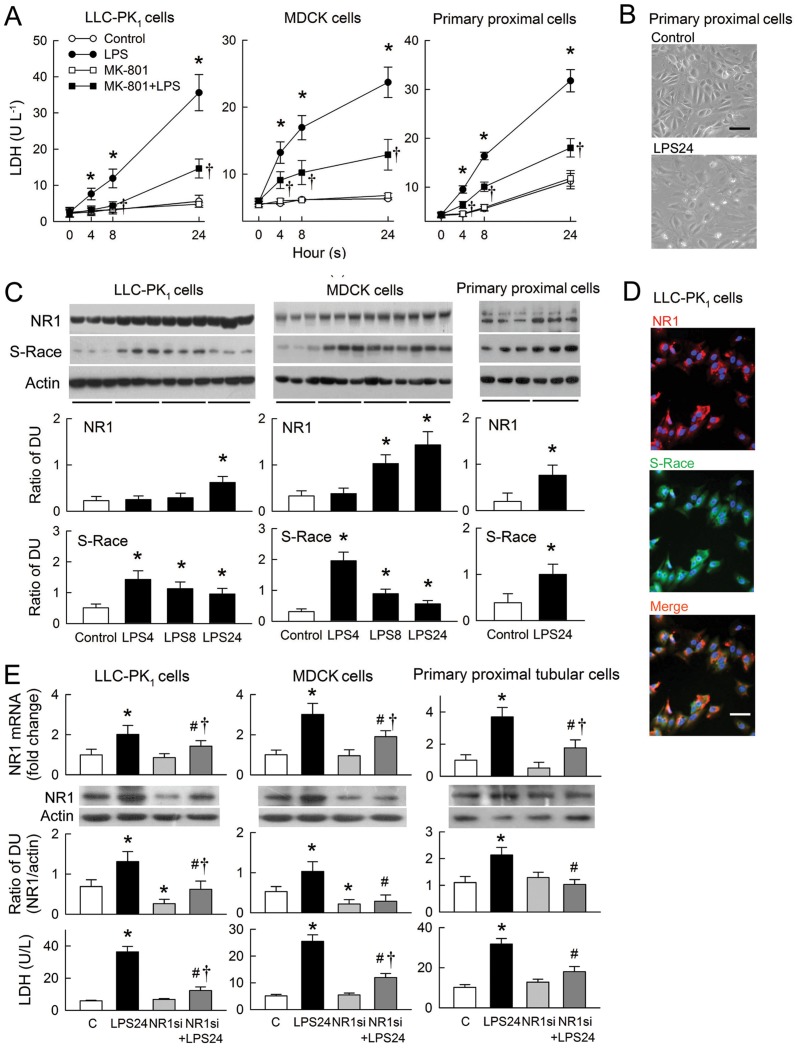
Fig 4. Effects of lipopolysaccharide (LPS) on renal tubular cells.
(A) Panels show lactate dehydrogenase (LDH) release in LLC-PK1 (left), MDCK (middle), and primary rat proximal tubular cells (right) treated with LPS, MK-801, or PBS (control) (n = 6). (B) Representative images showing morphological changes in primary rat proximal tubular cells treated with either PBS (control) or LPS for 24 h. (C) Representative blots of NR1, S-Race, and actin obtained from three separate culture wells. The bar graphs below show the densitometry data from six assays. (D) Representative images of immunofluorescence staining for NR1 (red) and S-Race (green) in untreated LLC-PK1 cells. Co-localized staining is orange (merged picture). Nuclei were counterstained with DAPI (blue). Magnification: ×400 in B and D. The horizontal bar in merged picture indicates 10 μm. (E) The upper bar graphs show silencing of NR1 mRNA as analyzed by real time RT-PCR. Results were expressed as fold changes with respect to LLC-PK1 (left column), MDCK (middle column), and primary rat proximal tubular cells (right column) receiving a negative control siRNA (C) (n = 6). The middle representative blots and bar graphs (n = 6) show changes in protein expression of NR1 in tubular cells after LPS treatment with or without NR1 siRNA by Western blot analysis. The lower bar graphs show the effects of NR1 siRNA on LDH release in tubular cells treated with various combinations of LPS or siRNA (n = 6). *P < 0.05 vs. the control (C) groups. #P < 0.05 vs. the LPS group at the same time-point or the LPS24 plus NR1 siRNA (NR1si)-treated group. †P < 0.05 vs. the MK-801 group or the NR1 siRNA-treated group.

