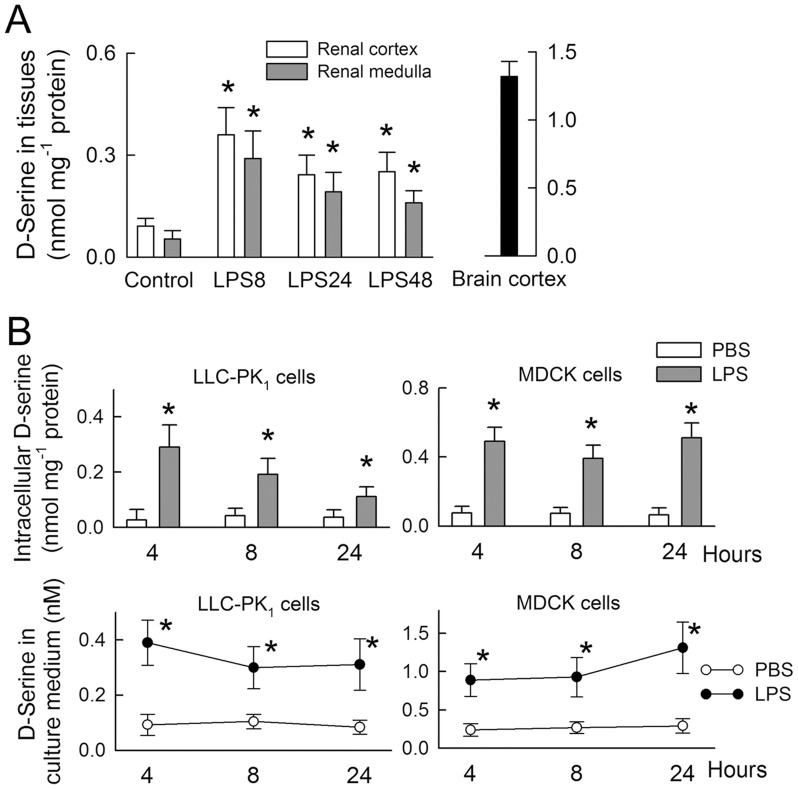
Fig 5. Changes in D-serine levels in renal tissues and tubular cells.
(A) D-serine levels in rat kidneys following lipopolysaccharide (LPS) or control treatment (n = 8). Bc, brain cortex. (B) Intracellular D-serine levels (upper panels) and levels of D-serine released into the culture medium (lower panels) following LPS or control treatment (n = 5). *P < 0.05 vs. the control (PBS-treated) group at the same time-point.

