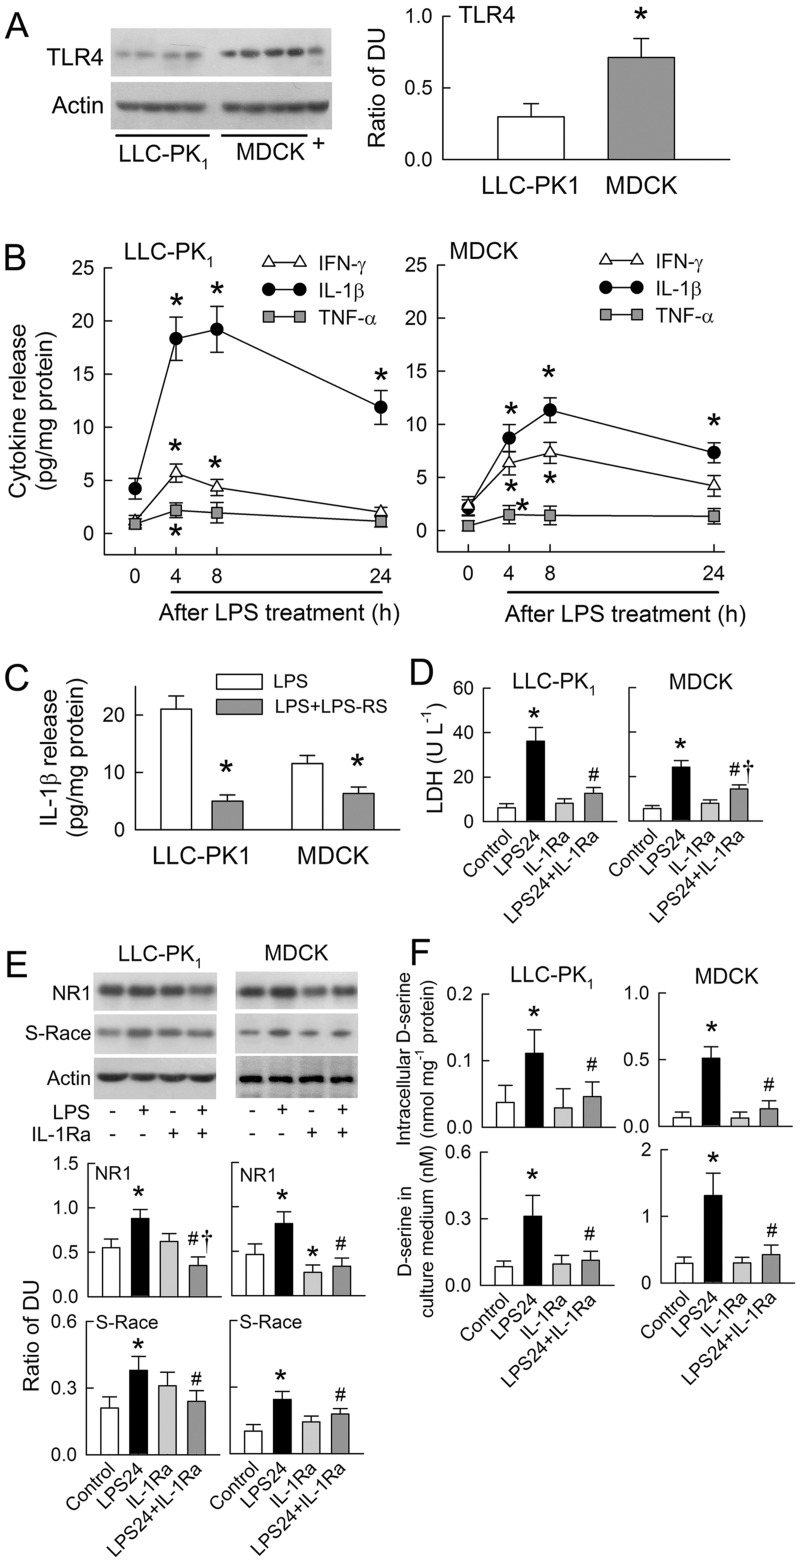
Fig 6. Cytokine effects of lipopolysaccharide (LPS)-induced N-methyl-D-aspartate (NMDA) receptor hyperfunction in tubular cells.
(A) Representative blots of TLR4 expression (left) with densitometry data (right) pooled from four separate cultures. +, positive sample extracted from rat liver. (B) Graphs show IFN-γ, IL-1β, and TNF-α release into culture medium before (zero time-point) and after LPS treatment (n = 6) in both LLC-PK1 (left) and MDCK cells (right). (C) TLR4 antagonist LPS-RS were co-treated with LPS in tubular cells for 8 h. The release of IL-1β in medium was determined (n = 6). (D) IL-1 receptor antagonist (IL-1Ra) attenuates LPS-mediated LDH release after 24 h of treatment (n = 5). (E) Representative blots showing NR1, S-Race, and actin expression in cells treated with LPS, IL-1Ra, or a combination of the two. The lower panels show densitometry data pooled from five separate cultures. (F) Intracellular D-serine levels (upper panels) and D-serine levels in the culture medium (lower panels) at 24 h post-treatment with LPS, IL-1Ra, or a combination of the two (n = 5). *P < 0.05 vs. the LLC-PK1,the zero time-point, or the control groups. #P < 0.05 vs. the LPS24 group. †P < 0.05 vs. the IL-1Ra group.

