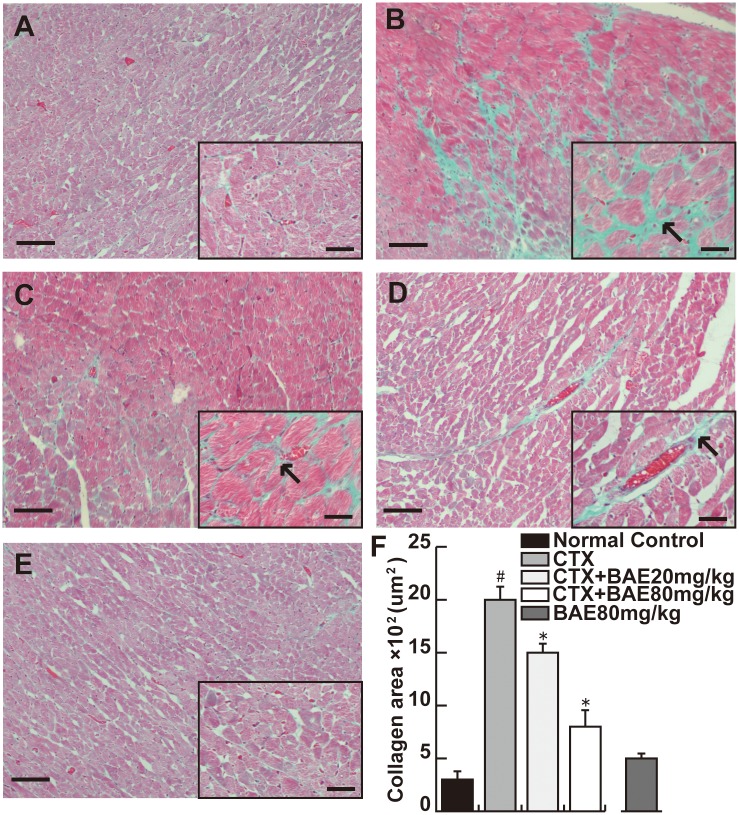
Fig 4. BAE attenuated CTX-induced LV fibrosis.
Masson trichrome—stained sections of left ventricles. (A) Normal control; (B) CTX group; (C) CTX+BAE 20mg/kg group; (D) CTX+BAE 80mg/kg group; (E) BAE80mg/kg. The arrow represents the cardiac fibrosis (Scale bar: 20μm). (F) Quantification of cardiac fibrosis area from Masson trichrome—stained sections. Data are mean ± SD. # p < 0.05, compared to normal control; *p < 0.05, compared to CTX.

