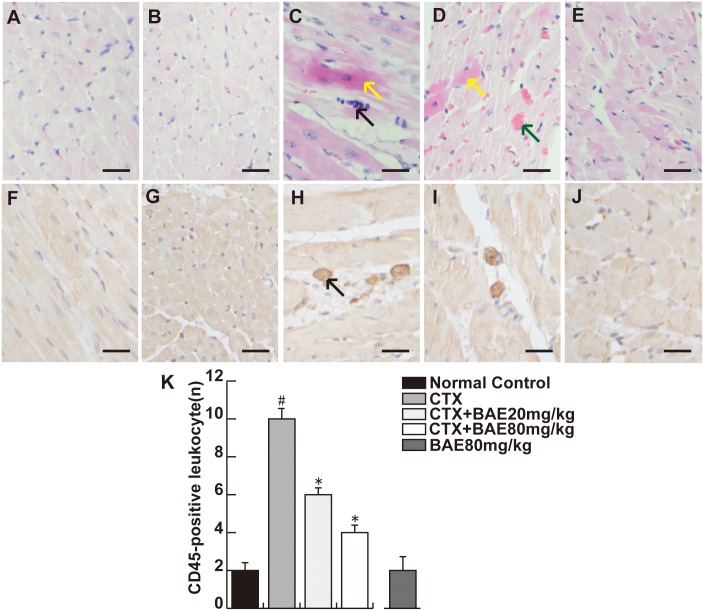
Fig 5. BAE attenuated CTX-induced LV inflammation.
A and F: Normal control; B and G: BAE80mg/kg; C and H: CTX group; D and I: CTX+BAE20mg/kg; E and J: CTX+BAE80mg/kg. (A-E) show the histopathological changes in CTX-induced cardiomyocyte. The black arrow in C and D represents respectively inflammatory cells infiltration and heart congestion, whereas the brown arrow represents cardiomyocyte apoptosis (HE staining, Bar: 20 μm). (F-J) demonstrate the infiltration of CD45-positive leukocytes in the left ventricle of the rats in four groups. The arrow in H represents the CD45-positive leukocytes (immunohistochemical staining, Bar: 20 μm). (K) Bar charts show a number of CD45-positive leukocytes in the myocardial interstitium. Data are mean ± SD. #p < 0.05, compared to normal control group; *p < 0.05, compared to CTX.

