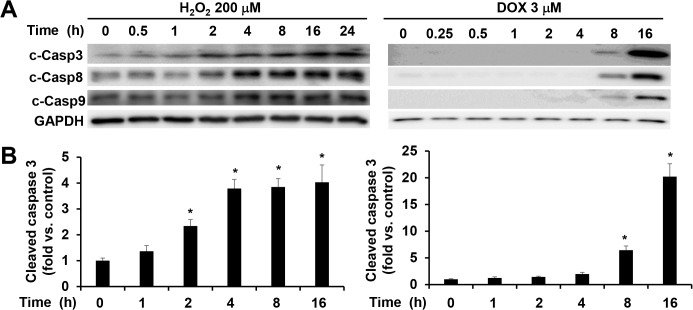
Fig 2. Different time courses of caspase activation by H2O2 versus doxorubicin.
(A) Representative image of Western blot of cleaved caspases 3, 8, and 9 in cell lysates from attached WT MEFs treated with 200 μM of H2O2 or 3 μM of doxorubicin at different time points as indicated. Equal amount of proteins were loaded. (B) Quantitative analysis of immunoreactive bands of cleaved caspase 3 expressed as fold change relative to WT control. n = 4–6 for each condition. * P < 0.05 vs. control.

