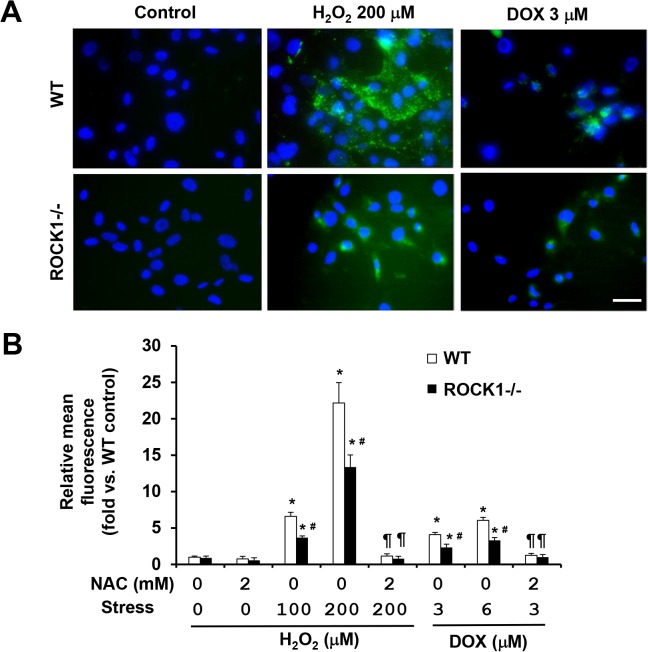
Fig 9. NAC and ROCK1 deletion reduce ROS levels induced by doxorubicin and H2O2 treatments.
(A). Representative images of CM-H2DCFDA staining of WT and ROCK1 -/- MEFs treated with 200 μM of H2O2 or 3 μM doxorubicin, and/or 2 mM NAC for 0 or 4h, and then exposed to 13 μM CM-H2DCFDA. Coverslip was mounted with AntiFade Mountant containing DAPI and imaged immediately. Bar, 50 μm. (B). Quantitative analysis of CM-H2DCFDA staining of WT and ROCK1 -/- MEFs treated as above followed by the measurement with microplate reader and image analytic system. At least 10,000 cells were analyzed in each condition. Fluorescence levels in WT cells at baseline were arbitrarily set at 1. * P < 0.05 vs. control of the same genotype. # P < 0.05 vs. WT under the same treatment condition. ¶ P < 0.05 vs. the same genotype under doxorubicin or H2O2 only condition.

