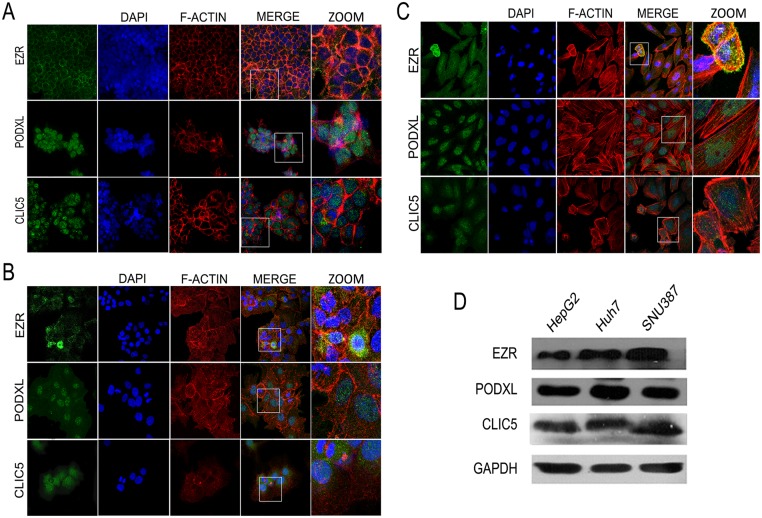
Fig 4. Expression and localization of EZR, PODXL and CLIC5 in HCC cell lines.
Localization of EZR, PODXL and CLIC5 in A) HepG2, B) Huh7 and C) SNU387 cell lines. Positive signals for each protein are shown in green. F-actin is shown in red, and nuclei are shown in blue. Magnified images are shown (ZOOM). D) Total protein expression of EZR, PODXL and CLIC5 in the three cell lines was evaluated by Western blot analysis. Each experiment was repeated at least four times.

