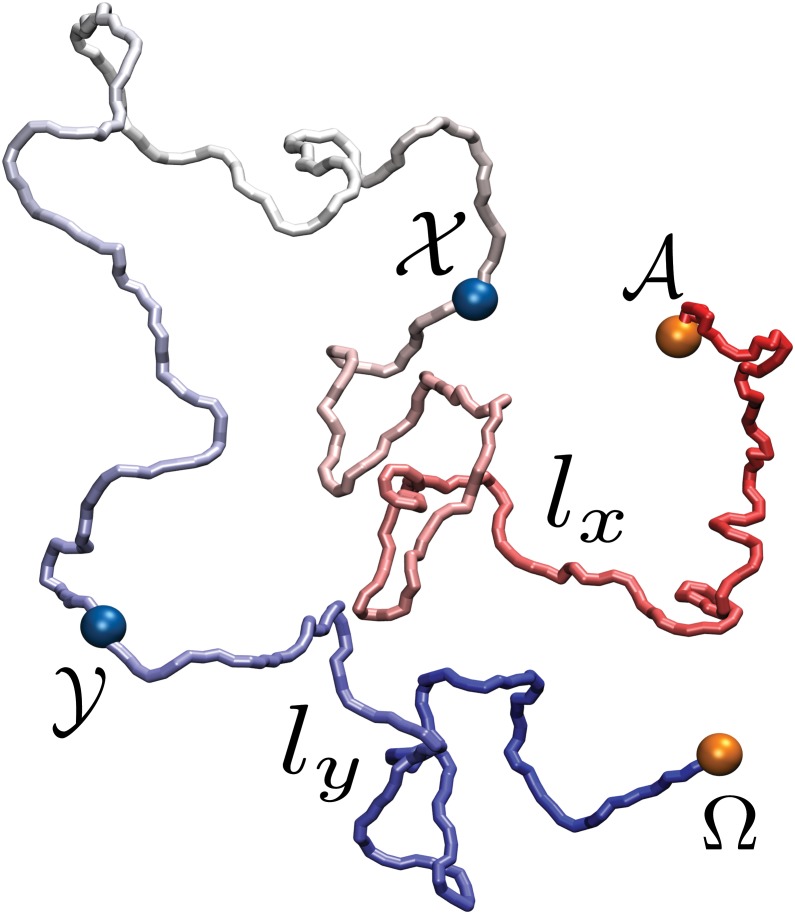
Fig 1. Snapshot of the DNA model under exam.
The orange beads, labeled 𝓐 and Ω, indicate the sticky patches at the termini of the polymer, while the blue beads, labeled 𝓧 and 𝓨, represent those along the polymer chain. These two pairs of regions do not attract each other. The chain segment comprised between 𝓐 and 𝓧 (resp. 𝓨 and Ω) has length l x (resp. l y).

