
Figure 2.
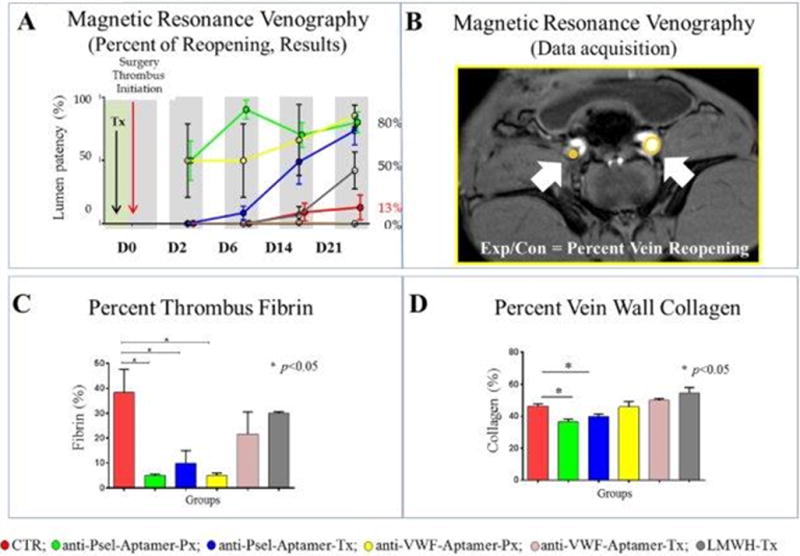
A) MRV percent reopening results: Magnetic resonance venography, time of flight, percent vein recanalization. Graph representing the percentage of reopening results from all groups at each time point. Circles represent the mean of the values obtained per animal per time point. D0: baseline; D2: two days after thrombosis; D6: six days after thrombosis; D14: fourteen days after thrombosis; D21: twenty-one days after thrombosis. B) MRV percent reopening: Representative picture showing the methodology to assess the percentage of recanalization. C) Percent of thrombus fibrin: Quantification of fibrin was calculated as percentage of fibrin-covered area in the thrombus at day 21 after thrombosis was initiated. Bars represent SEM. D) Percent of vein wall collagen: Masson trichrome analysis: Vein wall fibrosis was quantified by computerized analysis using Image J software (Scanalytics, Fairfax, VA). Three individual samples were analyzed per group for each time point. The mean fibrotic area was calculated from 10 to 12 regions of interest per vein wall section analyzed at 400× magnification. Bars represent SEM.
References: CTR: control group; anti-Psel-Aptamer-Px: P-selectin inhibitor prophylaxis group; anti-Psel-Aptamer-Tx: P-selectin inhibitor treatment group; LMWH-Tx: Low molecular weight heparin treatment group; anti-VWF-Aptamer-Px: von Willebrand factor inhibitor prophylaxis group; anti-VWF-Aptamer-Tx: von Willebrand factor inhibitor treatment group. Control group in red; anti-P-selectin aptamer prophylaxis in green; anti-P-selectin aptamer treatment in blue; anti-VWF aptamer prophylaxis in yellow; anti-P-selectin aptamer treatment in pink; LMWH treatment in grey.