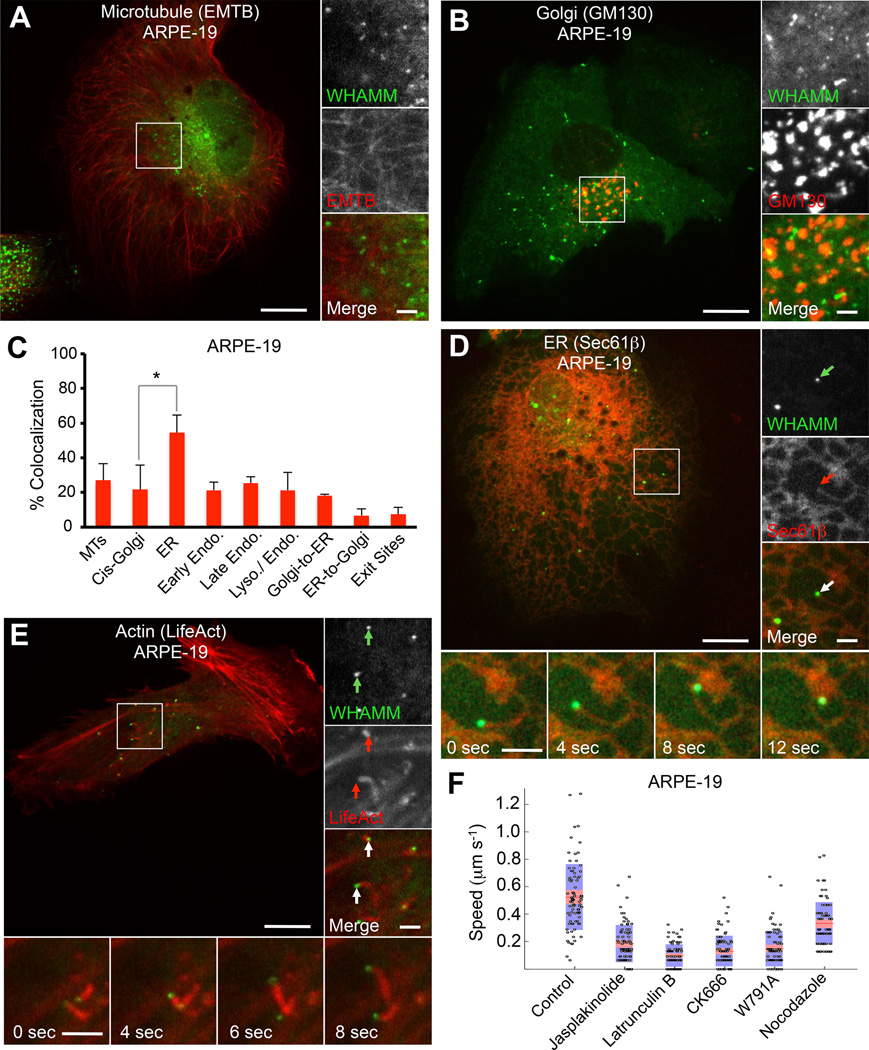
Figure 1. WHAMM Localizes to the ER and Induces the Formation of Actin Comet Tails.
(A) GFP-WHAMM puncta in ARPE-19 cells do not colocalize with the MT marker mCherry-EMTB.
(B) GFP-WHAMM forms dynamic puncta and small tubules in ARPE-19 cells 8 h post transfection. These puncta do not colocalize with the cis-Golgi marker mCherry-GM130.
(C) Quantification (±SEM; n=5–13 cells) of the colocalization of GFP-WHAMM in ARPE-19 cells with MTs (mCherry-EMTB), cis-Golgi (mCherry-GM130), ER (mCherry-Sec61β), early endosomes (mCherry-Rab5), late endosomes (mCherry-Rab7), enodo/lysosomes (RFP-Lamp1), Golgi-to-ER vesicles (mCherry-Arf1), ER-to-Golgi vesicles (mCherry-Sec-16L), and ER-exit sites (mCherry-Sec-24D).
(D) GFP-WHAMM puncta colocalize and comigrate with ER tubules (mCherry-Sec61β) in ARPE-19 cells cotransfected with GFP-WHAMM and the ER marker Sec61β. These tubules move with a mean speed of ~0.5 µm s−1. Insets show a WHAMM punctum (green arrow) comigrating with an ER tubule (red arrow).
(E) GFP-WHAMM puncta are propelled by actin comet tails in ARPE-19 cells, moving with an average speed of 0.5 µm s−1. Insets show WHAMM puncta (green arrows) leading actin comet tails (red arrows).
(F) Quantification of the speed of WHAMM puncta. Measured puncta speeds from five cells are presents as a ‘bee-swarm’ plot superimposed onto a box-and-whisker plot. The red area represents the middle half of the data, divided by the median value (red line). The blue area encompasses the data from the 5th to the 95th percentile.
Scale bars in whole cell and inset images are 10 and 2 µm, respectively.
*p < 0.05. See also Figure S1 and S2 and Movie S1.

