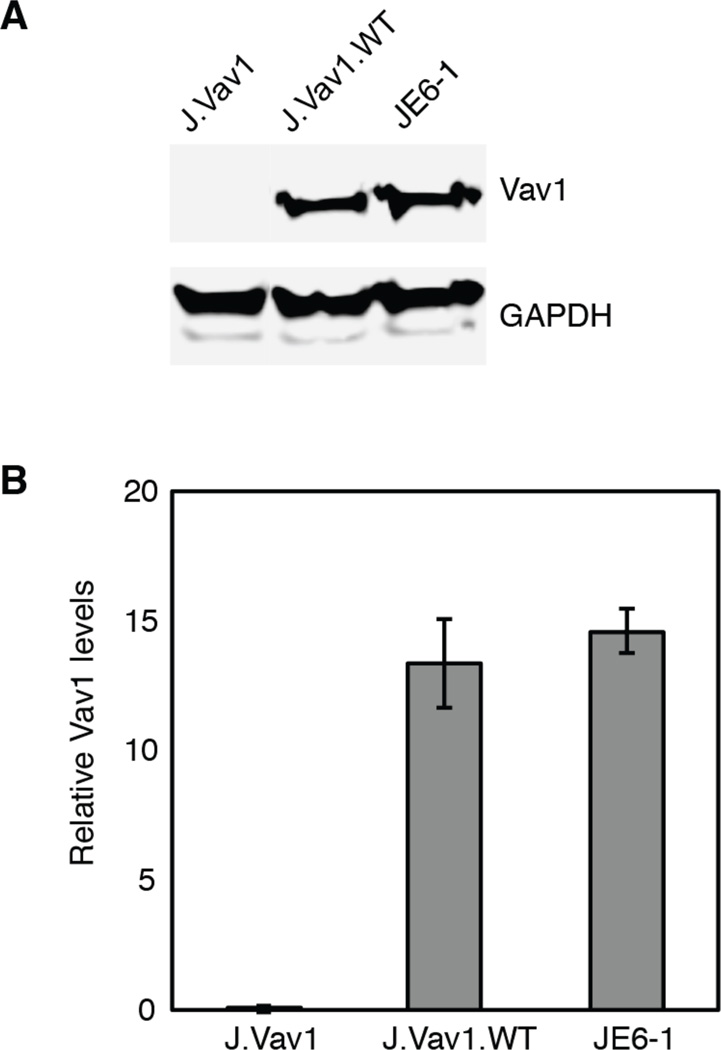
Figure 1. Vav1 expression in J.Vav1 and J.Vav1.WT cells.
A) J.Vav1, J.Vav1.WT, and Jurkat T cell (JE6-1) lysates were analyzed by Western blotting for Vav1 and GAPDH. B) Densitometric analysis of Vav1 levels normalized to GAPDH levels was performed. Shown is the mean ± S.D. from three biological replicate experiments.

