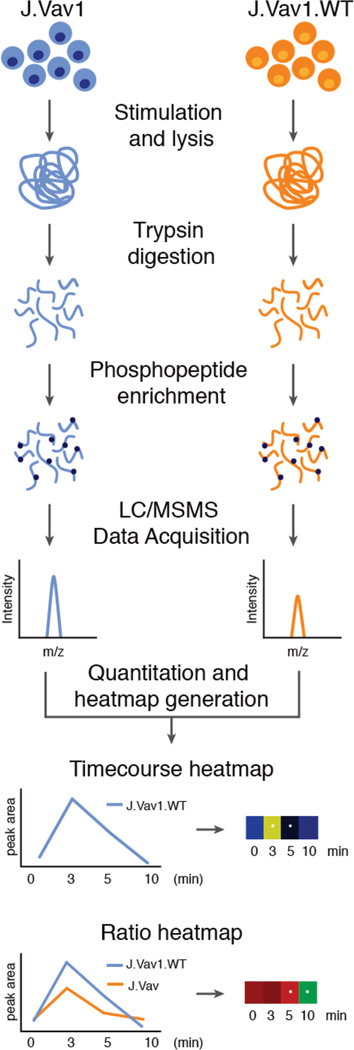
Figure 2. Experimental strategy.
J.Vav1 and J.Vav1.WT cells were pre-incubated with OKT3 and OKT4 antibodies for 30 seconds at 37°C and then cross-linked with IgG at 37°C for 0, 3, 5, and 10 minutes. Subsequent to lysis, samples were digested into peptides and enriched for phosphopeptides. Phosphopeptides from 5 biological replicates were identified using LC-MS/MS analysis and the resulting SIC peak areas of phosphopeptides from J.Vav1 and J.Vav1.WT cells were quantified. Temporal heatmaps were generated from the replicate average peak areas of each phosphopeptide across the time course of TCR stimulation. Ratio heatmaps were generated by taking the ratio of average replicate peak areas of J.Vav1 and J.Vav1.WT cells for each time point and phosphopeptide.

