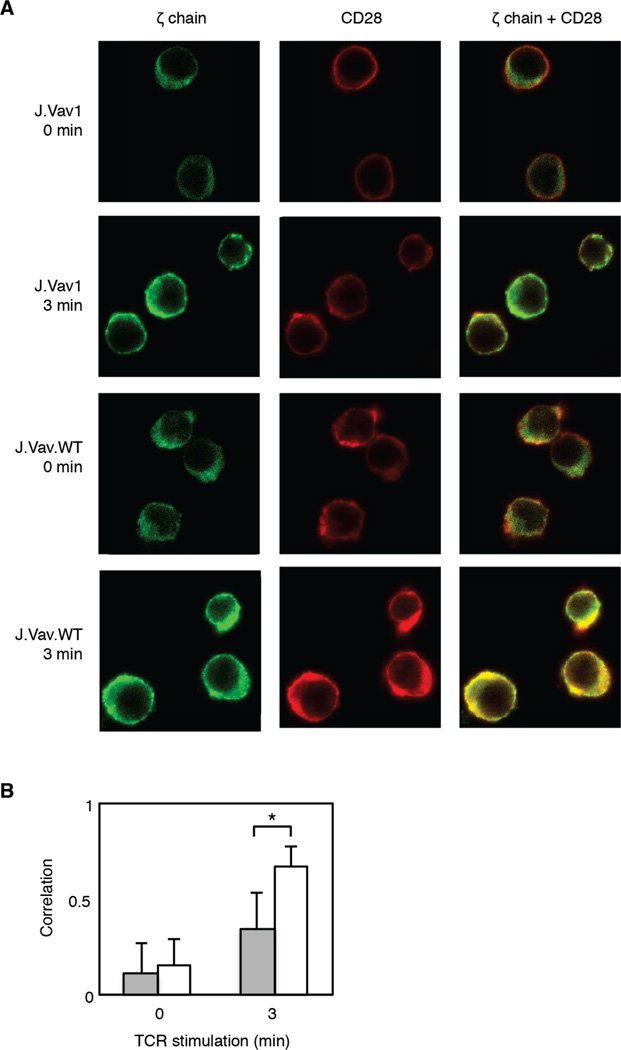
Figure 5. Colocalization of CD28 and ζ chain of the TCR is attenuated in Vav1-deficient T cells.
J.Vav1 and J.Vav1.WT cells stimulated for either 0 or 3 minutes were fixed and analyzed by confocal microscopy. Cells were labeled with goat anti-CD28 and mouse anti-ζ chain, washed, and subsequently labeled with the secondary antibodies Alexa Fluor 488 donkey anti-mouse and Alexa Fluor 647 donkey anti-goat. A) CD28 is represented in red and ζ chain is represented in green. Colocalized CD28 and ζ chain is shown in yellow. B) Colocalization was quantified using the ZEN software in which colocalization coefficients, derived from the Pearson’s correlation coefficient, were calculated. Gray bars represents J.Vav1 cells and white bars represents J.Vav1.WT cells. Shown is the mean ± S.D. from 75 cells for each cell type and time point. Student t-tests identified statistically significant differences in colocalization between stimulated J.Vav1 and J.Vav1.WT cells (*-p value < 1×10⁻⁹).

