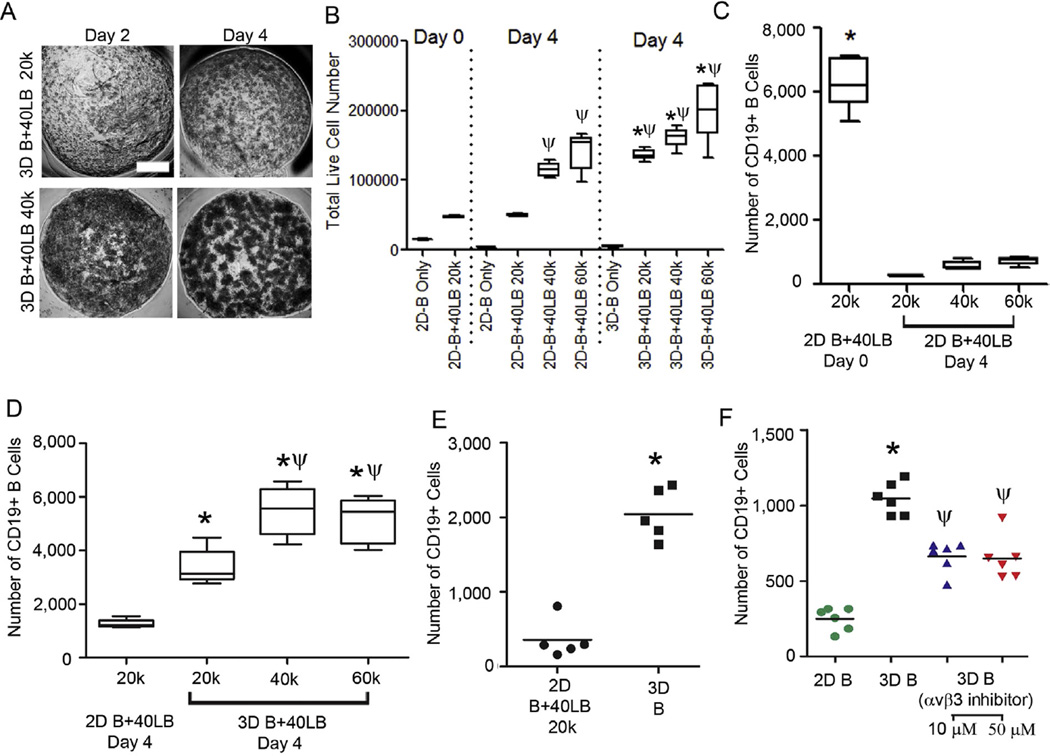
Fig. 4.
Ex vivo proliferation of primary B cells within the immune organoid and role of integrins. (A) Phase images representing B cell proliferation within the organoids with varying number of stromal cells as a function of time. Scale bar: 500 µm. (B) Total number of viable cells on day 0 and 4. Box-whisker plot, *P < 0.05 w.r.t 2D groups on day 4 and ψP < 0.05 w.r.t day 0, 1-way ANOVA with post-hoc Tukey’s correction. (C, D) Fold expansion plot of CD19+ cells in different matrix architectures (2D vs. 3D) and various 40LB cell amounts (20,000,40,000, and 60,000) after 6 days in culture (Box-whisker plot, n = 5). Each hydrogel (10 µL) consisted of 20,000 naïve B cells and at the completion of study, harvested cells from each hydrogel were equally divided into 3 groups for analysis. *P < 0.05 w.r.t 2D groups and ψP < 0.05 w.r.t 3D with 20,000 40LBs, 2-way ANOVA with post-hoc Bonferroni correction. (E) Number of CD19+ cells in 2D co-cultures with 40LB (n = 5) and 3D organoids with no 40LB *P < 0.05, t-test. (F) Number of CD19+ cells in 2D versus 3D systems after 2 days in the presence or absence of 10 or 50 µM Cilengitide (Mean ± S.E.M, n = 5). *P < 0.05 w.r.t 2D groups and ψP < 0.05 w.r.t 3D without Cilengitide, t-test.

