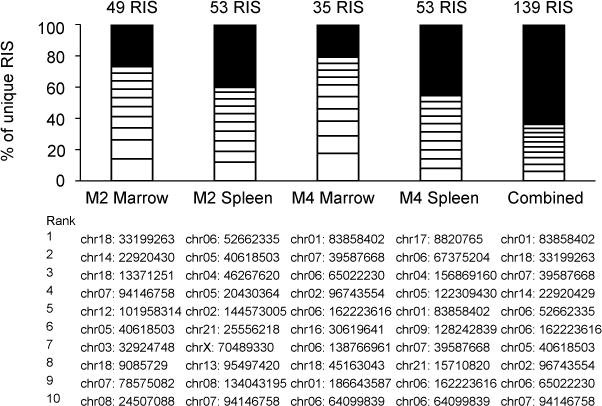
Figure 2.

Clonality in bone marrow and spleen. RIS ranked 1–10 by capture frequency are shown as white rectangles. All others are shown as black rectangles. Locations are indicated for the ten most frequently captured RIS in each sample. Abbreviations: chr, chromosome; M, mouse; RIS, retroviral insertion site.
