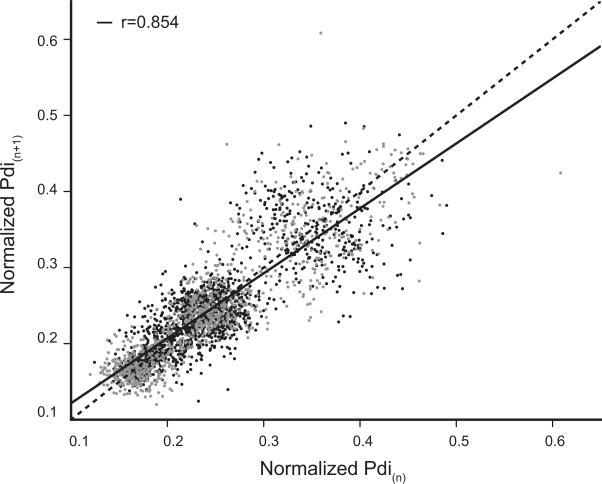
Figure 6.
Poincaré plot for Pdi(n+1) vs. Pdi(n) (Pdi normalized to spontaneous sighs; n = 7 mice). Data was acquired across motor behaviors: eupnea – black dots, hypoxia-hypercapnia – gray dots. There was a large level of correlation between successive Pdi amplitudes across both eupnea and hypoxia-hypercapnia (r = 0.85; p < 0.001).

