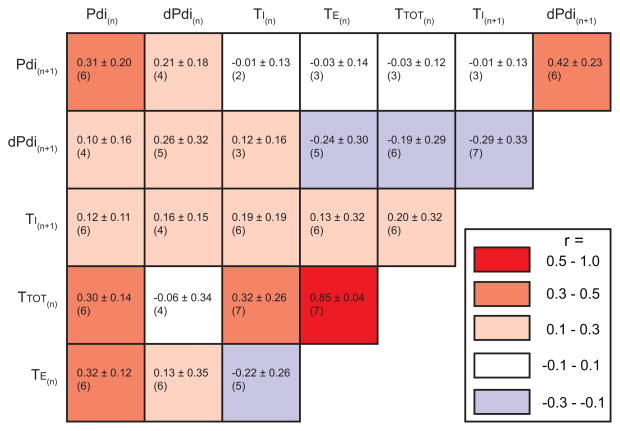
Figure 7.
Composite matrix of linear relationships between respiratory variables. Variables analyzed include Pdi amplitude, estimated premotor drive (dPdi), inspiratory time (TI), expiratory time (TE) and the total time (TTOT). Average (± SD) correlation coefficients (r) are reported in each interaction box along with the number of animals (out of 7) displaying a significant (p < 0.05) correlation. The color of each box indicates the average level of correlation according to the map (right) and ranges from positive (red) to negative (blue), with color intensity binned into 4 levels: none (0.0 – 0.1), small (0.1 – 0.3), moderate (0.3 – 0.5), and large (0.5–1.0).

