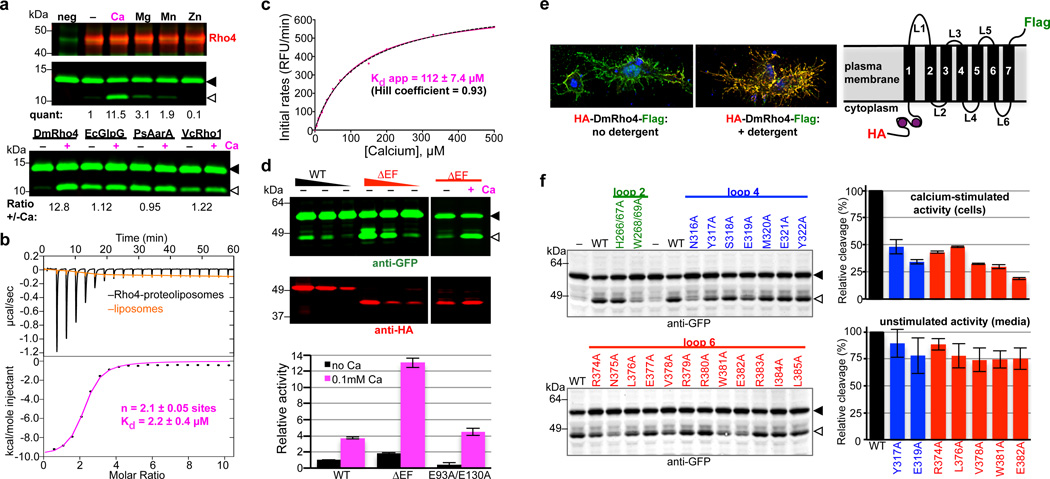
Figure 2. Calcium directly regulates intramembrane proteolytic activity of DmRho4.
a Proteolysis assay with pure reconstituted DmRho4 ± a panel of 1mM divalent metal ions (upper panels), and four different rhomboid enzymes reconstituted into proteoliposomes ± calcium (lower panel). EcGlpG is from Escherichia coli, PsAarA is from Providencia stuartii, and VcRho1 is from Vibrio cholerae. b Analysis of calcium binding to DmRho4 in proteoliposomes by isothermal titration calorimetry (upper graph shows the thermograms, lower graph is the liposome-subtracted quantification). c Calcium titration analysis of DmRho4 proteolysis using an inducible real-time reconstitution assay16. Black dashed line shows an alternate fit with an optimal Hill coefficient. d Titration of wildtype (WT) and ∆EF DmRho4 in S2R+ cells comparing basal, unstimulated Spitz cleavage (left panel) and Spitz cleavage by DmRho4-∆EF ± calcium ionophore (right panel; also see Extended Data Set 2a). Lower graph shows in vitro activity of WT and EF-Hand mutants of DmRho4 in proteoliposomes (error bars indicate standard deviation for experimental replicates). e Topology of 3xHA-DmRho4-Flag in S2R+ cells as assessed by deconvolution immunofluorescence. The N-terminal HA-tag (red) was inaccessible while the C-terminal Flag tag (green) was accessible in the absence of detergent, indicating that the N-terminus is cytosolic while the C-terminus of DmRho4 is extracellular (blue marks nuclei). f Ability of DmRho4 cytosolic loop mutants to cleave GFP-Spitz in response to calcium ionophore stimulation in S2R+ cells was quantified by anti-GFP western analysis (also see Extended Data Set 2b for DmRho4 levels). Graphs show activity of selectively compromised loop 4 and 6 mutants under calcium-stimulated conditions in cells (upper graph) versus unstimulated conditions (lower graph, measured as cleavage product accumulation in culture media after 24 hours, also see Extended Data Fig. 2c). Error bars indicate standard deviation for experimental replicates. Black triangles and open triangles denote substrate and cleavage bands, respectively, throughout.

