Figure 1.
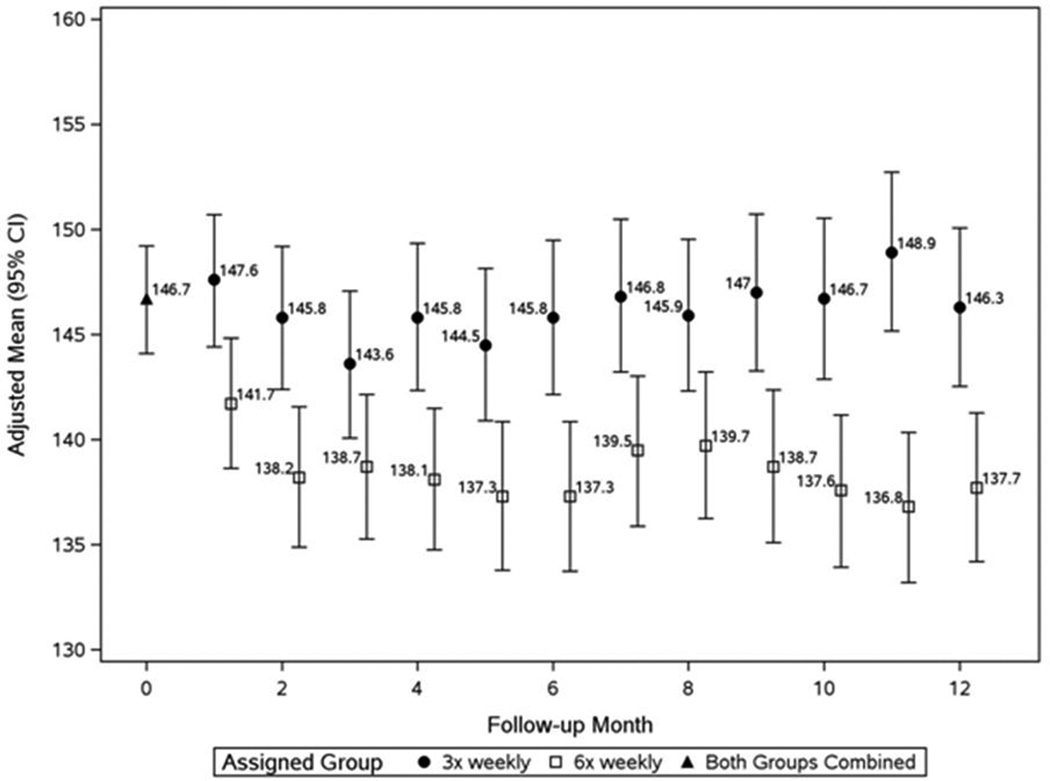
a: Monthly pre-dialysis systolic blood pressure in the Daily Trial
Patients in the 6× weekly group (open squares) had significantly lower values than the 3× weekly group (closed circles) at F1 (P<0.001) and thereafter (mixed effects analysis adjusting for baseline value of outcome and clinical center).
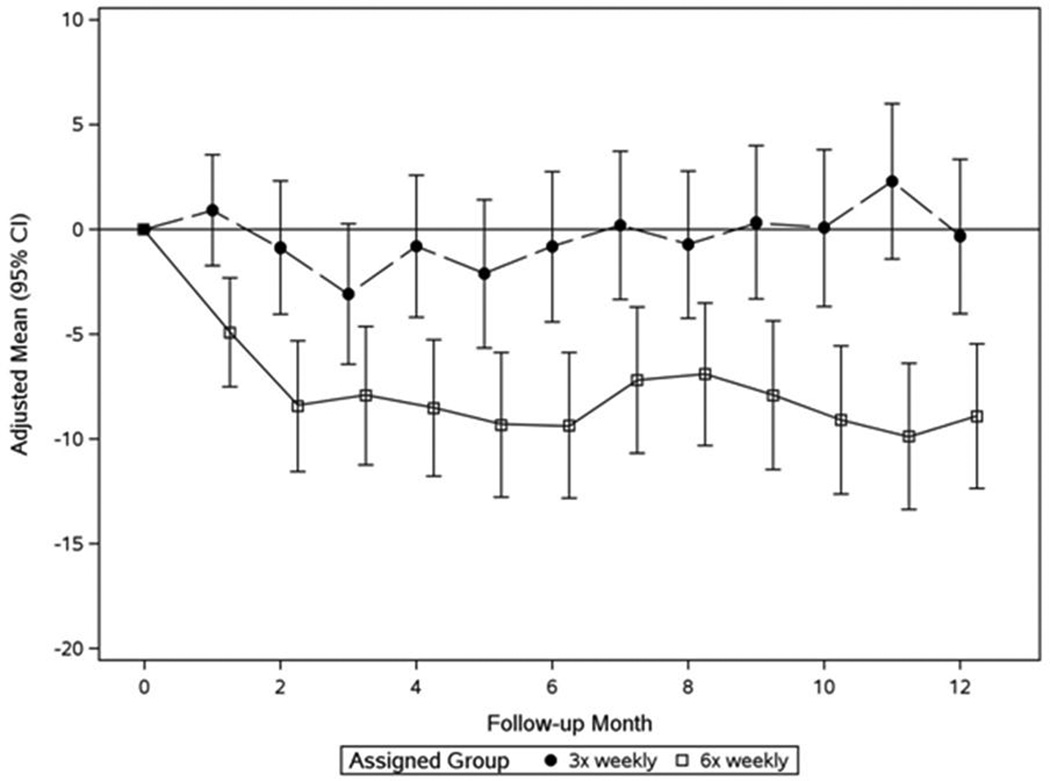
b: Monthly mean changes of pre-dialysis SBP from baseline in the Daily Trial
Patients in the 6× weekly group (open squares) had significantly lower values than the 3× weekly group (closed circles) at F1 (P<0.001) and thereafter (mixed effects analysis adjusting for baseline value of outcome and clinical center).


