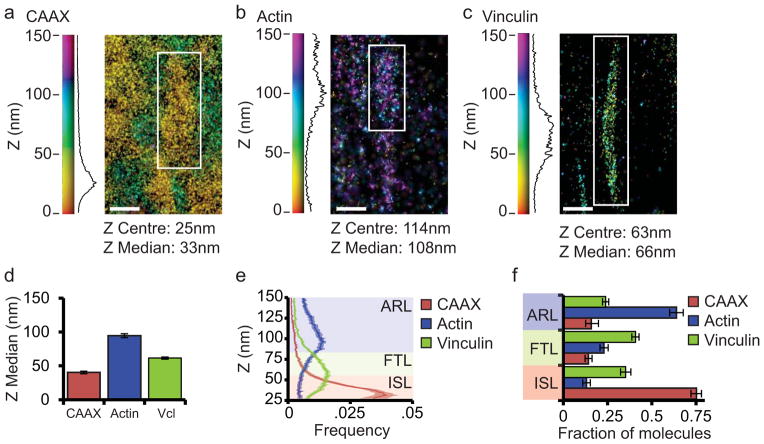
Figure 1. Vinculin is distributed throughout the three FA nano-domains.
(a, b, c) Representative iPALM renderings from HFFs expressing CAAX-tdEos to label the plasma membrane (a), actin-mEos2 to label actin (b), or vinculin-N-tdEos (c). In (a–c) the colourscale represents Z-position (nm), FAs oriented with the distal tip facing up, scale bar = 1 micron. Histograms of the Z-position of molecules within individual FAs (white boxes in a–c) displayed next to the colourscale. The measured Gaussian Z-centre and Z-median of the distribution is shown. (d) Mean of Z-median measurements from individual FAs. (e) Averaged Z-position frequency histograms of molecules within FAs. Solid line, mean frequency; Shaded region, bootstrapped 95% confidence intervals. (f) Mean fraction of molecules localized to each of the three FA layers. Colouring in (e, f) is used to highlight the three FA layers. ISL: integrin signaling layer (red, 25–54 nm above the coverslip), FTL: force transduction layer (green, 55–84 nm above the coverslip), ARL: actin regulatory layer (purple, 85–150 nm above the coverslip). Graphs in (d–f) represent measurements of n=27 FAs from 5 CAAX-tdEos expressing cells, n=56 FAs from 8 actin-mEos2 expressing cells and n=115 FAs from 8 vinculin-N-tdEos expressing cells Data in all bar graphs are represented as mean ± bootstrapped 95% confidence intervals.

