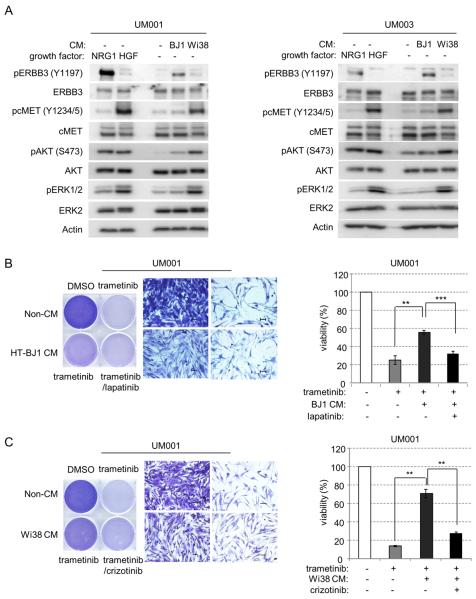
Figure 6. Paracrine effects of NRG1 and HGF from fibroblasts drives resistance to trametinib in UM cells.
(A) UM001 and UM003 cells were cultured for 1 hr in unconditioned growth medium or fibroblast conditioned medium (CM) collected from either HT-BJ1 cells or Wi38 cells. Cells treated with 10 ng/ml of NRG1 and HGF were used as control. Activation of ERBB3, cMET, AKT and ERK1/2 were analyzed by Western blotting. (B) UM001 cells were cultured in conditioned medium collected from HT-BJ1 cells (CM) or unconditioned medium (non-CM). Cells were treated with 100 nM trametinib ± 1 μM lapatinib, as indicated. After 72 hr, cells were stained with crystal violet. Representative microscopic images were shown with a 200× magnification. Scale bar is equal to 50 μm (left). Cell viability was also assessed by AlamarBlue® staining after 72 hr (right). (C) UM001 cells were cultured in conditioned medium collected (CM) from Wi38 cells or unconditioned medium (non-CM), as a control. Cells were treated with 100 nM trametinib and 0.5 μM crizotinib as indicated. After 72 hr, cells were stained with crystal violet. Representative microscopic images were shown with a 200× magnification. Scale bar is equal to 50 μm (left). AlamarBlue® staining was also performed to determine viability (right).

