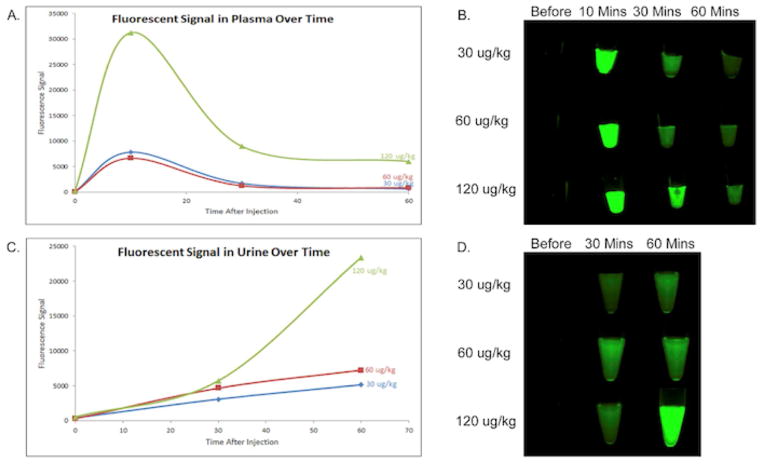
Figure 3. Fluorescence Signals of the Plasma and Urine Over Time.
(A. and B.) Fluorescence signals over time in the plasma for all doses. (C. and D.) Fluorescence signals over time in the urine for all doses. Values shown are mean fluorescence signal, error bars represent standard error. Images were captured with the 800 nm filter on the Pearl.

