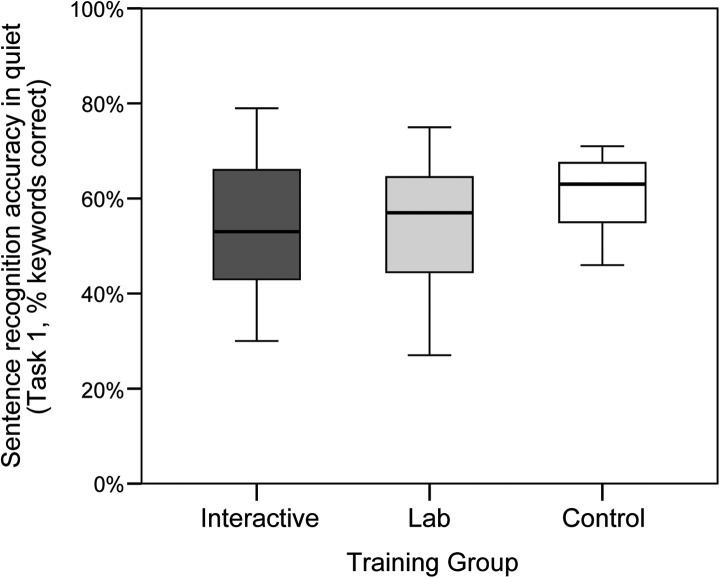
Figure 2.
Pretest Task 1 (sentence recognition in quiet) performance by training group. Here and elsewhere, boxplots show median accuracy scores for each group (solid horizontal line) within shaded 25th to 75th percentile ranges. Error bars reflect 95% confidence intervals, and outliers are shown as individual points. Differences between groups were not significant prior to training.

