
Figure 2.
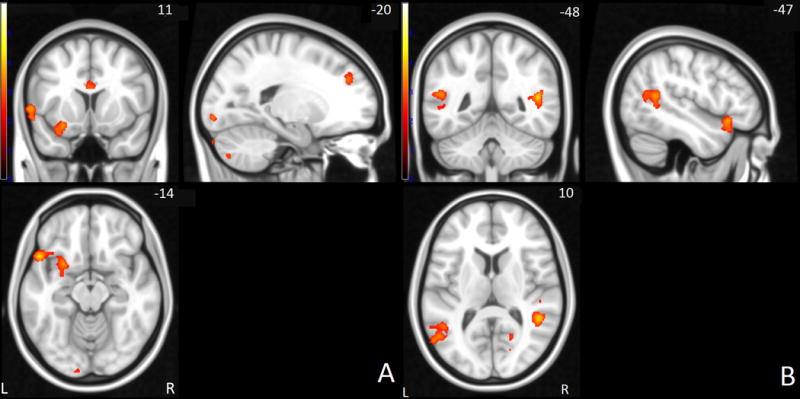
Failed stop > go network: Brain activation differences between controls and siblings or participants with ADHD in frontal (A) and parietal areas (B). Yellow hues correspond to higher signal in control subjects. Right side of the image corresponds to the right hemisphere of the brain.