
Fig. 11.
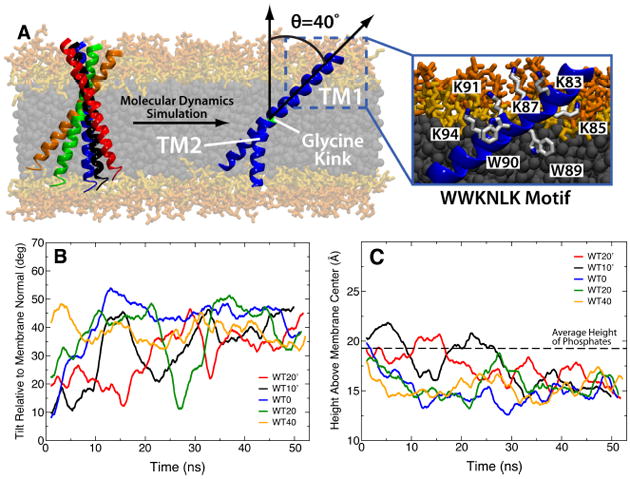
Native tilt angle of the synaptobrevin TM domain. (A) The five initial conditions of synaptobrevin tilt simulated are shown together with the final structure. All simulations converged to an average tilt of 40.1±3.4° with the two segments of the helix (TM1 and TM2) mechanically decoupled by the G100 “glycine kink”. A detailed image of the specific interactions leading to the well-defined orientation of TM1 are shown in the inset. Plots of the angle relative to membrane normal (B) and height of tryptophan residues above membrane center (C) are shown for each of the five simulations, with the color of the trace in each plot matching the color of the helix in (A). In (C), the black dashed line represents the average height of phosphates in the leaflet closest to the tryptophans (upper leaflet in (A)) across all simulations.