
Fig. 12.
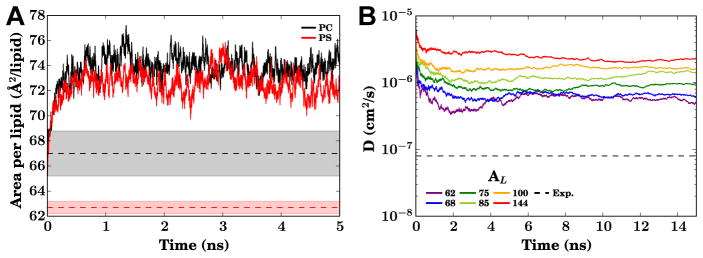
(A) The evolution of the area per lipid of HMMM bilayers in a constant ratio barostat for both PC (black) and PS (red) headgroups, highlighting the bilayer expansion possible due to the shorter acyl tails. For reference, the range of experimental areas per lipid (AL) determined through a combination of X-ray and neutron scattering methods by Fogarty et al (2015) are reported as shaded regions, with the mean as a dashed line. (B) Lateral lipid diffusion constant (DL) time evolution for PC HMMM bilayers over a range of AL maintained by a fixed-area barostat. The dashed line in this panel represents the DL of ~ 8 × 10⁻⁸ cm2s−1 for DPPC lipids(Klauda et al, 2006; Wohlert and Edholm, 2006), consistent with most conventional bilayers. The simulations behind this data were conducted using NAMD 2.10 (Phillips et al, 2005) on bilayers constructed using CHARMM-GUI (Jo et al, 2008, 2009; Wu et al, 2014) at 310 K.