
Fig. 9.
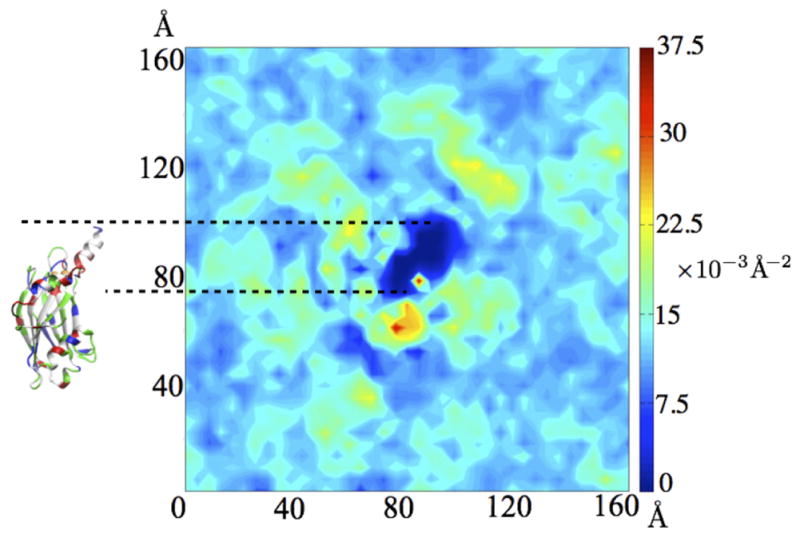
Two-dimensional lipid head group density of the cis leaflet around synaptotagmin C2B domain (top view) resulting from simulations employing the HMMM model. The C2B domain with its protruding C-terminal helix is shown to scale on the left. The color of the density plot reflects the lipid occupancy per unit area, measured using the phosphorous atom of the lipid headgroup.