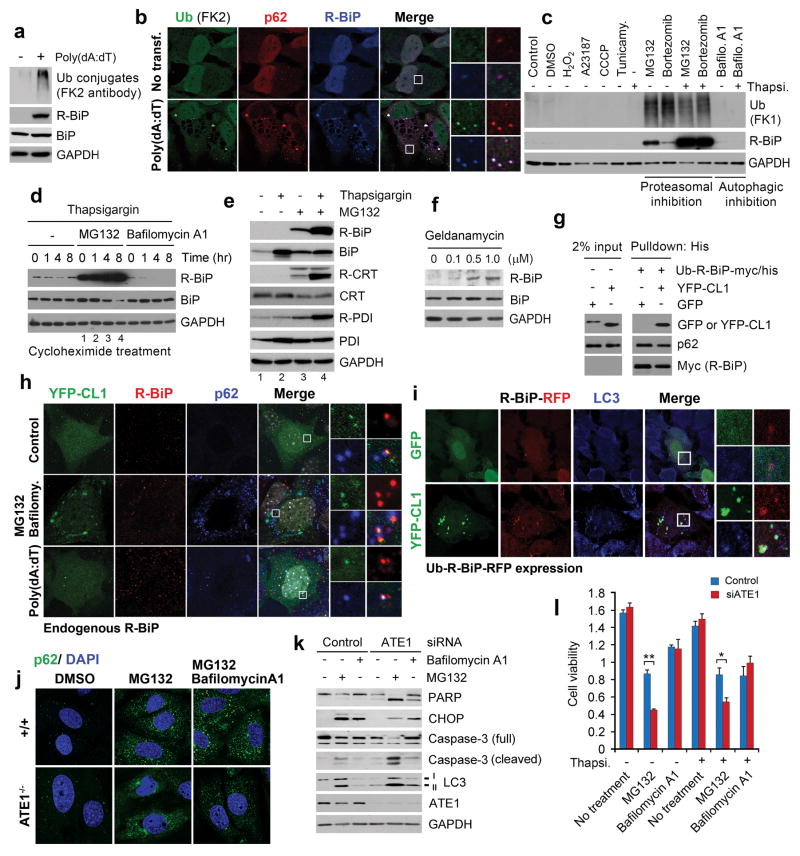
Figure 7.
R-BiP is induced by and associated with cytosolic misfolded proteins, and ATE1-deficient cells are hypersensitive to misregulation of protein quality control. (a) Immunoblotting analysis of R-BiP and Ub conjugates in HeLa cells treated with 0.4 μg/ml poly(dA:dT) for 16 hrs. (b) Colocalization assay with antibodies specific to Ub conjugates (FK2 antibody), p62, and R-BiP in HeLa cells treated with 1 μg/ml poly(dA:dT) for 21 hrs. Scale bar, 10 μm. (c) HeLa cells were treated with various stressors for 24 hrs as described in Methods and subjected to immunoblotting analysis of R-BiP and Ub conjugates using FK1 antibody. (d) HeLa cells were treated with 10 μM MG132 in combination with 200 nM thapsigargin or 200 nM bafilomycin A1 for 16 hrs. The cells were treated with 10 μg/ml cycloheximide, followed by immunoblotting assay. (e) Arginylation of ER proteins is synergistically induced by proteasomal inhibition and ER stress. HeLa cells were treated with 10 μM MG132 and 100 nM thapsigargin for 18 hrs. (f) The treatment of geldanamycin, an inhibitor of the HSP90, for 17 hrs results in co-induction of autophagy with arginylation of ER-residing chaperons. (g) Measurement of the interaction between R-BiP and CL1-YFP, a model substrate that undergoes spontaneous misfolding. See Methods for experimental details. (h) Colocalization assay of YFP-CL1 with R-BiP and p62. MEFs ectopically expressing YFP-CL1 was treated with 1 μg/ml poly(dA:dT) alone for 18 hrs or 10 μM MG132 and 200 nM bafilomycin A1 for 6 hrs, followed by immunostaining of endogenous R-BiP and p62 in comparison with YFP-CL1 fluorescence. Scale bar, 5 μm. (i) Ub-R-BiP was coexpressed with YFP-CL1 or GFP in HeLa cells, followed by fluorescence analysis. (j) Puncta formation assay of p62 in +/+ and ATE1−/− MEFs treated with 10 μM MG132 and/or 0.2 μM bafilomycin A1 for 6 hrs. (k) Control and ATE1-knockdown cells were treated with 10 μM MG132 and/or 0.2 μM bafilomycin A1 for 18 hrs, followed by immunoblotting analysis. (l) MTT assay of control and ATE1-knockdown cells treated with various stressors, including 10 μM MG132. Mean +/− s.d. of n=3 independent experiments in which 10,000 cells in a 24-well plate were analysed per experimental point. Statistical significance was calculated using a two-way ANOVA test (* p < 0.05; ** p < 0.01).

