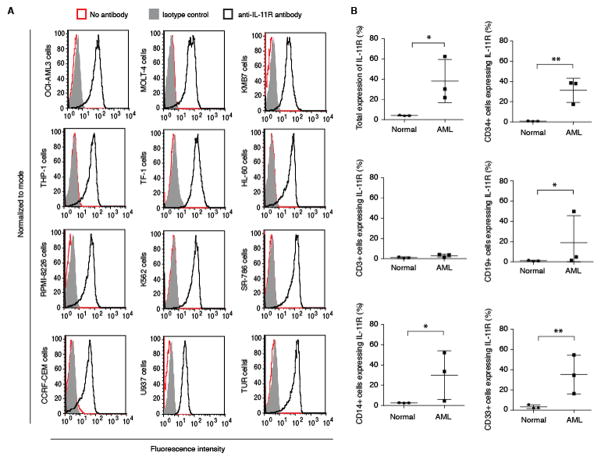
Figure 1.
Flow cytometry analysis of cell surface expression of IL-11R. (A) The expression of IL-11R was studied in a panel of leukemia cell lines (n=12). Cell samples were stained as follows: unstained cells (red line), control IgG (solid grey), anti-IL-11R antibody (black line). (B) The expression of IL-11R was studied in the patient derived AML samples and hematopoietic cells from healthy donors. The expression levels were analyzed at the total mononuclear blood cell population level, as well as in individual peripheral blood cell populations, identified by relevant CD markers.

