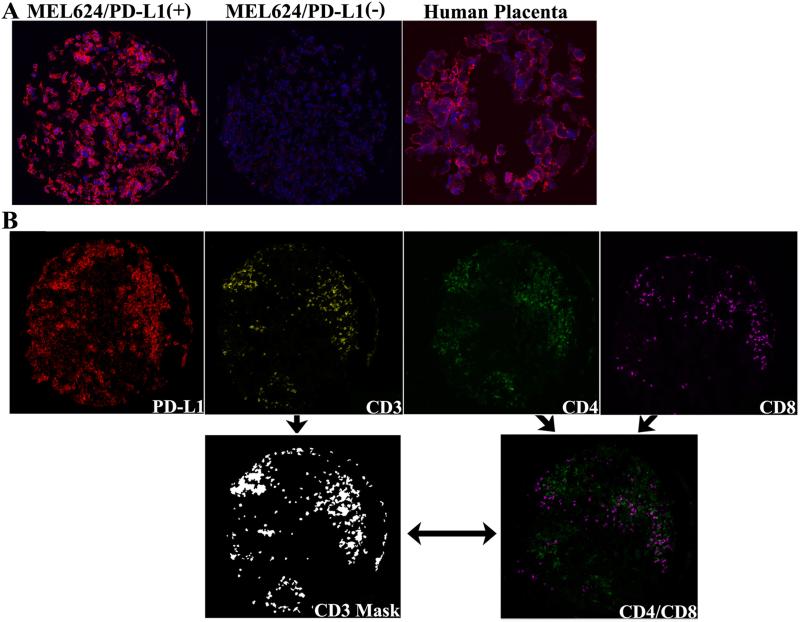
Figure 1.
Quantitative immunofluorescent staining of PD-L1 on tumor cells and quantification of CD3-, CD4- and CD8 TILs. A. Staining is shown in histospots of formalin fixed, paraffin embedded MEL624 cells transfected to overexpress PD-L1 or non-transfected and human placental tissue. DAPI (4,6-diamidine-2-phenylindole) was utilized to identify nuclei and Cy5 to visualize the target. B. Example of a tumor spot showing high PD-L1 expression and high CD3-, CD4- and CD8 lymphocytic content. PD-L1 intensity on tumor cells was calculated on a scale of 1-250. The percentage of either CD3-positive T-cell area or of the CD4- or CD8-positive T-cell subsets within the total tumor area (including stroma) was used to assess the degree of tumor lymphocytic infiltration (TIL density) on a cohort of metastatic melanoma specimens.

