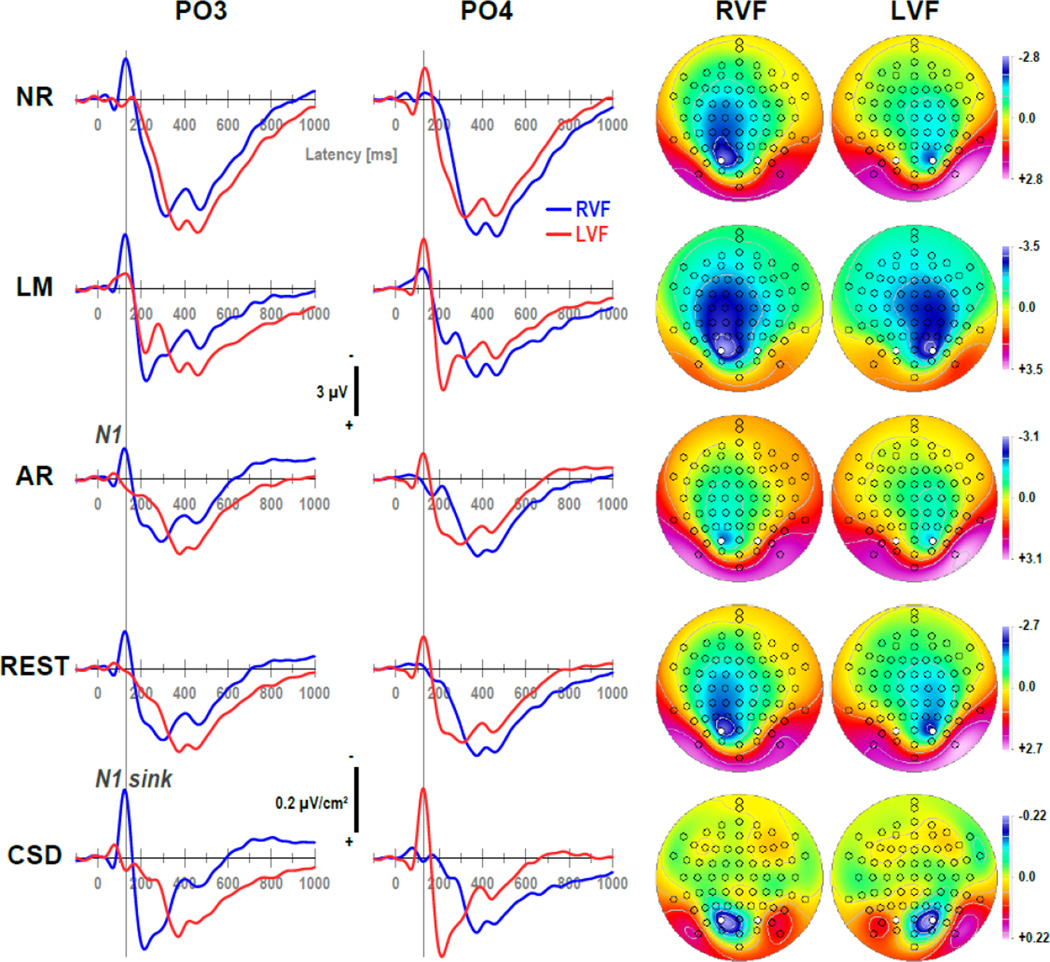
Figure 2.
Grand mean (N = 130) ERP [µV] (NR: nose reference; LM: linked-mastoids reference; AR: average reference; REST: reference electrode standardization technique) and surface Laplacian [µV/cm2] (CSD: current source density) waveforms (−100 to 1000 ms, 100 ms pre-stimulus baseline) comparing stimulus presentations to the right (RVF) or left visual field (LVF) at mid-parieto-occipital sites (PO3/4; locations marked white in maps). Topographies plotted for each hemifield are two-dimensional representations of spherical spline interpolations (m = 2; λ = 0) derived from the corresponding N1 or N1 sink values at 125 ms (indicated by vertical line), using a symmetric scale optimized for each data range.

