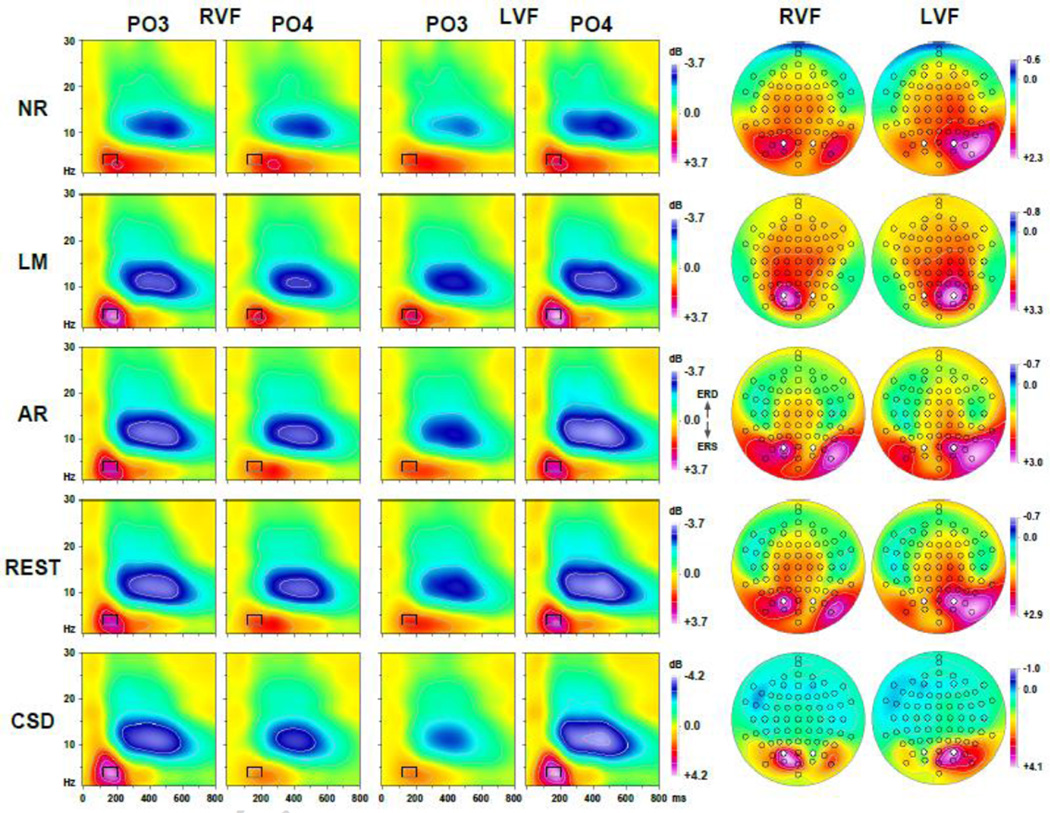
Figure 5.
Grand mean event-related spectral perturbation (ERSP) plots (0 to 800 ms; 1 to 30 Hz) for ERP [µV] (NR, LM, AR, REST) and CSD [µV/cm2] data comparing stimulus presentations to the right (RVF) or left visual field (LVF) at mid-parieto-occipital sites (PO3/4; locations marked white in maps). Mean ERSP values between 3 and 5 Hz and 120 and 200 ms (indicated by rectangle) reflecting event-related synchronization (ERS) are plotted as topographies for each hemifield using an asymmetric scale optimized for each data range.

