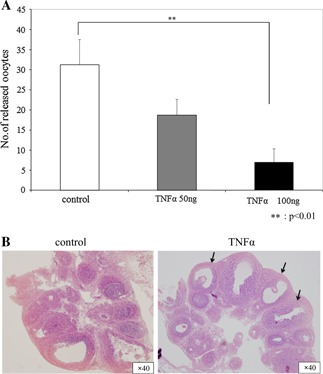
Figure 1.

Number of released oocytes and histological examination of the ovaries. The number of oocytes is shown as the mean ±SD (a). A significant difference (p < 0.01) was found between groups (n = 4). Many unluteinized, unruptured follicles were observed 24 h after hCG treatment in the TNFα group (arrows), though many corpus luteinized follicles were observed in the control group (b)
