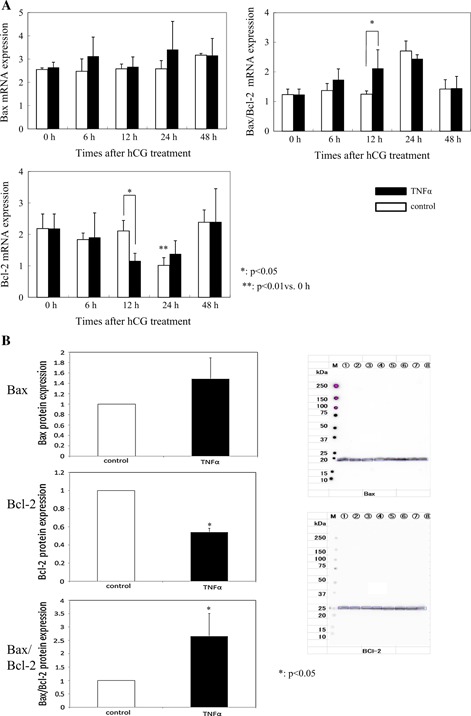
Figure 3.

Expression of the Bcl‐2 family. TNFα did not affect Bax expression. TNFα significantly reduced Bcl‐2 mRNA expression (p < 0.05), and the Bax/Bcl‐2 mRNA ratio increased (p < 0.05) 12 h after hCG administration compared with the control group (a). Western Blot analysis at 12 h after hCG administration shows that TNFα significantly reduced Bcl‐2 expression (p < 0.01) and the Bax/Bcl‐2 ratio increased (p < 0.05) (b). Lanes 1–4 were the TNFα group and lanes 5–8 were the control group. They were normalized to GAPDH values
