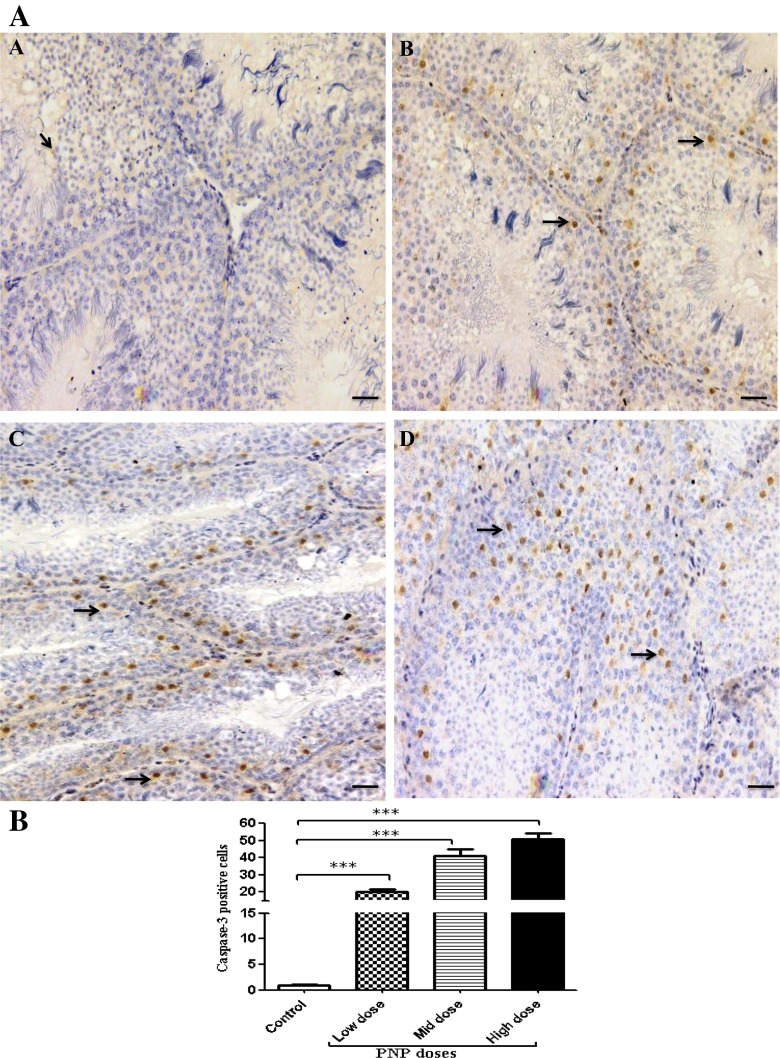
Fig. 6.
Representative caspase-3 expression in testes sections from the control (a) and the PNP-treated groups; the low does (b), the mid dose (c), and the high dose (d). The positive cells have brown nuclei (arrows). The main expression appears in the PNP-treated groups in the spermatogenic cell and spermatocyte. The scale bar represents 50 μm. b Quantitative analysis of caspase-3-positive cells in the testes of the control and the PNP-treated groups (n = 5). The positive cells were counted in 30 fields/slid. **P < 0.01; ***P < 0.001—in the PNP-treated groups vs. the control group

