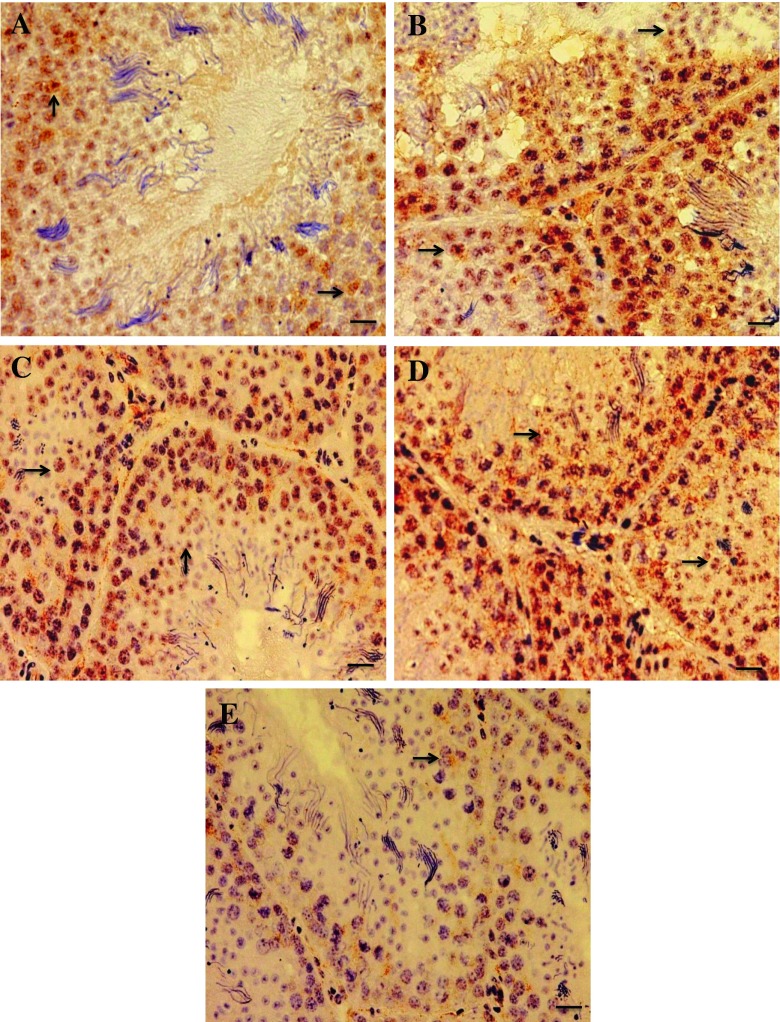
Fig. 7.
Expression of claudin-1 in testes sections from the control (a) and the PNP-treated groups; the low dose (b), the mid-dose (c), and the high dose (d, e). The expression appears in brown color (arrows). In the control group, the expression was found in early spermatocytes. In all the PNP-exposed bird, the claudin-1 expression founded widely spread in the seminiferous tubules and interstitial tissue in early and late spermatocytes. Moreover, in the high dose of PNP, some animals were showed low expression of the claudin-1 (e). The scale bar represents 20 μm

