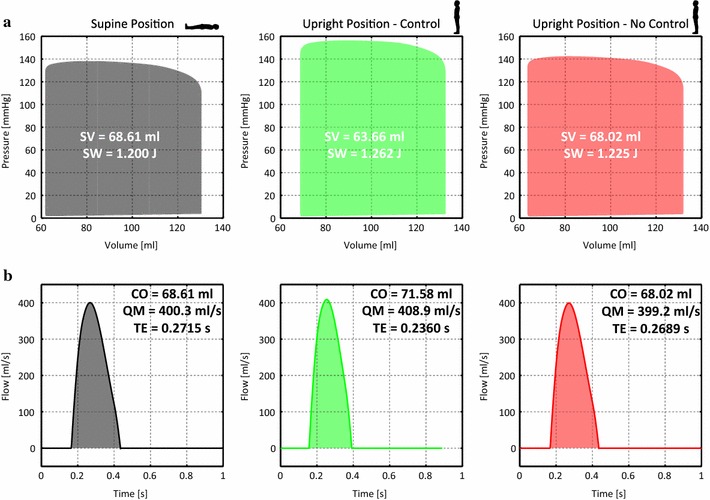
Fig. 7.

Ventricular pressure–volume loops and aortic flow waveforms in the initial supine and upright positions in both the no-control and control cases. Labels: SV stroke volume, SW stroke work, CO cardiac output, QM maximum flow rate, TE ejection time
