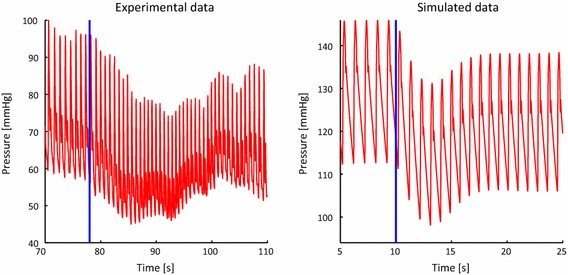
Fig. 9.

Comparison of experimental and simulated pressure recovery during the head up tilt test. The experimental data was obtained by digitizing the data contained in Williams et al. (2013) using the software Plot Digitizer http://plotdigitizer.sourceforge.net/. The simulated data is taken from the left internal carotid vessel in the control case. In both plots, the start of the tilt test is denoted with the solid blue line
