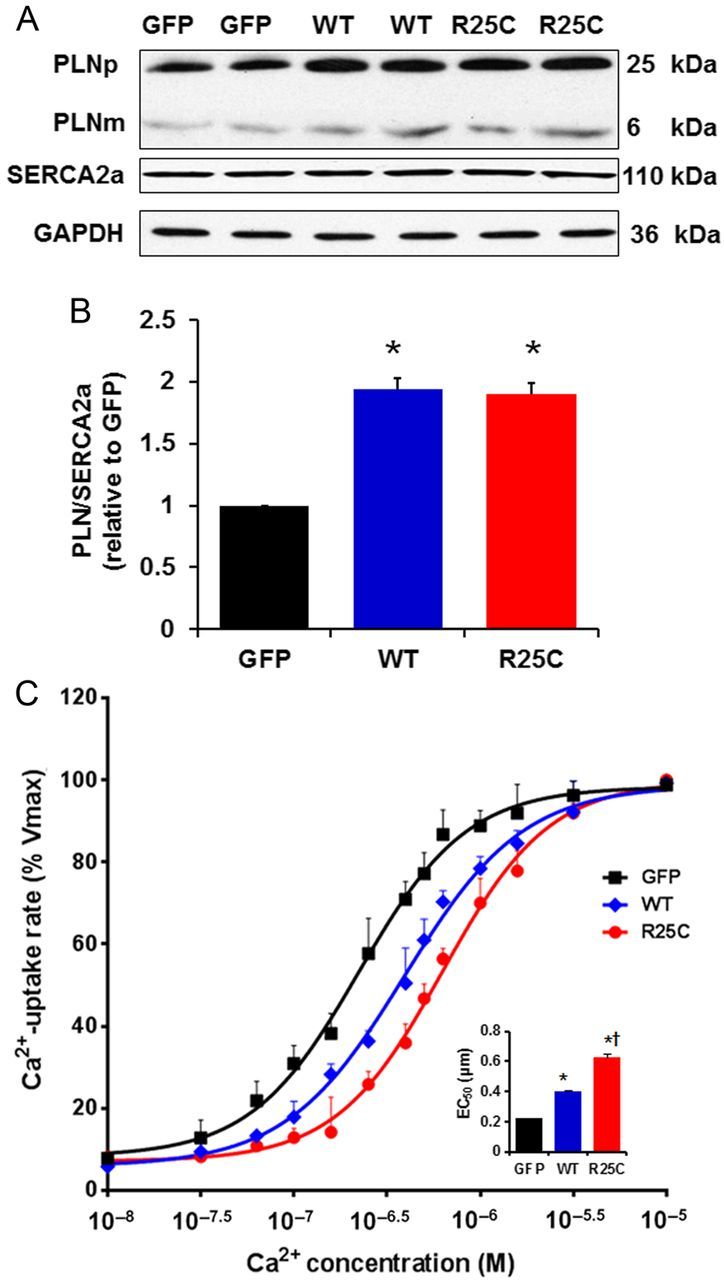
Figure 2.

Quantitative immunoblots from infected cardiomyocytes and Ca2+ uptake assays. (A) Representative blots of PLN and SERCA. PLNp, pentameric PLN; PLNm, monomeric PLN; (B) PLN protein levels in GFP, WT and R25C cardiomyocytes expressed as relative ratio of PLN/SERCA2a (n = 4 hearts); (C) Effects of wild-type and mutant R25C-PLN on the apparent Ca2+ affinity of SERCA2a. After 24-h infection with adenoviruses, cardiomyocytes were homogenized and the initial rates of oxalate-supported SR Ca2+ uptake were measured. Data are expressed as per cent of maximal uptake rates in each group (Vmax: 99 ± 4 in GFP, 101 ± 3 in WT, and 96 ± 5 in R25C, nmol/mg/min). Inset: The average EC50 values for the three groups (n = 6 hearts). *P < 0.05, vs. GFP; †P < 0.05, vs. WT. Values are mean ± SE.
