Figure 4.

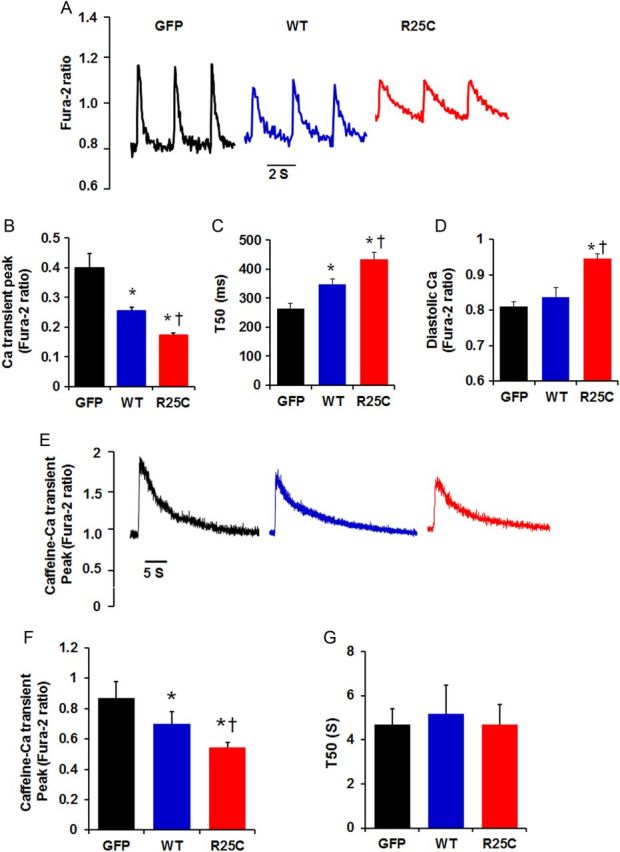
Ca2+ kinetics in Ad.GFP, Ad. WT-PLN, and Ad.R25C-PLN cardiomyocytes. Infected myocytes were incubated with Fura-2/AM for half an hour and Ca2+ transients were measured. (A) Representative tracings of Ca2+ transients; (B) Ca2+ transient amplitude in infected cardiomyocytes; (C) Time to 50% decay (T50) of Ca2+ signal; (D) Intracellular diastolic Ca2+; (E) Representative tracings of caffeine (10 mM)-induced Ca2+ transient; (F) Caffeine-induced Ca2+ transient amplitude; (G) Time to 50% decay (T50) of caffeine-induced Ca2+ transient peak (20–25 cells were measured per experiment or each heart; n = 4 hearts for GFP, WT-PLN, and R25C-PLN groups). *P < 0.05, vs. GFP; †P < 0.05, vs. WT. Values are mean ± SE.
