Figure 6.
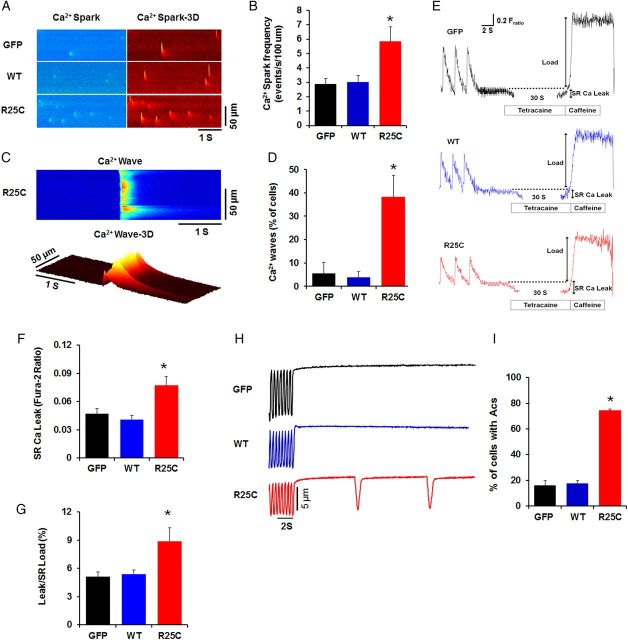
Ca2+ sparks, waves, diastolic SR Ca2+ leak, and stress-induced aftercontractions (Acs) in GFP, WT-PLN, and R25C-PLN cardiomyocytes. (A) Representative line-scan and three-dimensional (3D) images of Ca2+ sparks acquired in infected cardiomyocytes; (B) Cumulative data on Ca2+ spark frequency; (C) Representative line-scan and 3D images of Ca2+ waves acquired in R25C-PLN cardiomyocytes; (D) Percentage of cells showing Ca2+ waves (10–15 cells were measured per experiment or each heart; n = 6 hearts for GFP, WT-PLN, and R25C-PLN groups); (E) Representative traces of SR Ca2+ leak were obtained from the three groups. Ca2+ leak was determined as the tertacaine sensitive drop in diastolic −2 ratio; (F) Comparison of average diastolic SR Ca2+ leak; (G) Quantification of leak/SR load relationships in GFP, WT, and R25C myocytes (ratio of twitch Ca2+ transient/caffeine-induced Ca2+ transient (10–12 cells were measured per experiment or each heart; n = 4 hearts for GFP, WT-PLN and R25C-PLN groups); *P < 0.05, vs. WT and GFP. Values are mean ± SE. (H) Representative traces of Acs; (I) Percentage of the infected cardiomyocytes that developed Acs (10–12 cells were measured per experiment or each heart; n = 6 hearts for GFP, WT-PLN, and R25C-PLN groups). *P < 0.05, vs. GFP and WT. Values are mean ± SE.

